
Seller's Agent in 2022
Phuong Ai Liu
Virtual Properties Realty.com
(678) 936-5825
3 in this area
28 Total Sales
Estimated Value: $408,083 - $443,000
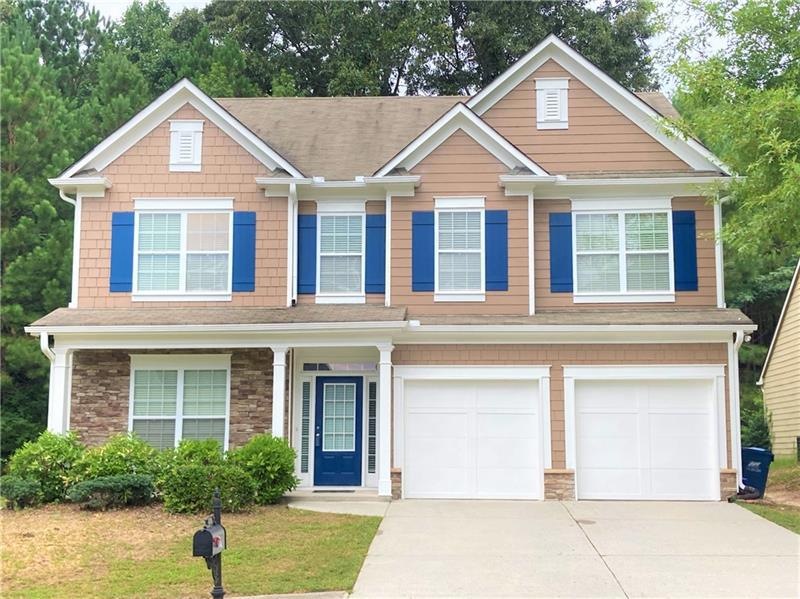
Move-in ready home in Buford, conveniently located near Mall of GA, restaurants, stores and shops, schools, parks, just minutes away from major interstates and roads, and in a great school district! Two-story home features an open concept floor plan on the main level and all bedrooms on the upper level. The welcoming foyer opens to a Living Room and coat closet on the left then continues to a spacious Family Room with a Fireplace, a Dining Area, and an open Kitchen with a kitchen island and stone counters. There is also a half bathroom, Laundry Room, and storage closet on the main level near the Garage entrance. Upper level features a large Master Suite with an ensuite bathroom with a separate tub and shower, walk-in closet, and double vanities. Three Secondary Bedrooms with windows overlooking the front of the house and a full bathroom are also located on the upper level. The home has the following upgrades: BRAND NEW washer and dryer, all newly painted interior walls, new smoke and carbon monoxide detector in every bedroom, a pressure-washed garage, driveway, porch, patio, and exterior, and newly painted exterior trims. Owner is a licensed real estate agent. **Carpets were deep cleaned, please wear shoe covers.**
| Date | Buyer | Sale Price | Title Company |
|---|---|---|---|
| Xie Sophie Shuyi | $430,000 | -- | |
| Son Ngoc | $113,200 | -- | |
| National Residential Assets Co | -- | -- | |
| Chung Yeonmee | $216,500 | -- |
| Date | Status | Borrower | Loan Amount |
|---|---|---|---|
| Open | Xie Sophie Shuyi | $344,000 | |
| Previous Owner | Chung Yeonmee | $173,100 |
| Date | Event | Price | List to Sale | Price per Sq Ft | Prior Sale |
|---|---|---|---|---|---|
| 09/23/2022 09/23/22 | Rented | $2,250 | 0.0% | -- | |
| 09/19/2022 09/19/22 | Under Contract | -- | -- | -- | |
| 09/07/2022 09/07/22 | Price Changed | $2,250 | -4.3% | $1 / Sq Ft | |
| 07/20/2022 07/20/22 | For Rent | $2,350 | 0.0% | -- | |
| 05/17/2022 05/17/22 | Sold | $430,000 | +7.5% | $199 / Sq Ft | View Prior Sale |
| 04/21/2022 04/21/22 | Pending | -- | -- | -- | |
| 04/13/2022 04/13/22 | For Sale | $400,000 | 0.0% | $185 / Sq Ft | |
| 03/14/2019 03/14/19 | Rented | $1,500 | -3.2% | -- | |
| 03/04/2019 03/04/19 | For Rent | $1,550 | +24.0% | -- | |
| 07/01/2012 07/01/12 | Rented | $1,250 | 0.0% | -- | |
| 06/01/2012 06/01/12 | Under Contract | -- | -- | -- | |
| 05/14/2012 05/14/12 | For Rent | $1,250 | 0.0% | -- | |
| 03/27/2012 03/27/12 | Sold | $113,200 | -2.2% | $50 / Sq Ft | View Prior Sale |
| 02/26/2012 02/26/12 | Pending | -- | -- | -- | |
| 01/04/2012 01/04/12 | For Sale | $115,800 | -- | $51 / Sq Ft |
| Year | Tax Paid | Tax Assessment Tax Assessment Total Assessment is a certain percentage of the fair market value that is determined by local assessors to be the total taxable value of land and additions on the property. | Land | Improvement |
|---|---|---|---|---|
| 2025 | $6,236 | $168,040 | $32,800 | $135,240 |
| 2024 | $5,961 | $158,320 | $36,000 | $122,320 |
| 2023 | $5,961 | $146,760 | $26,800 | $119,960 |
| 2022 | $4,709 | $123,880 | $26,800 | $97,080 |
| 2021 | $3,872 | $98,840 | $21,760 | $77,080 |
| 2020 | $3,894 | $98,840 | $21,760 | $77,080 |
| 2019 | $3,447 | $90,120 | $21,040 | $69,080 |
| 2018 | $3,247 | $84,360 | $15,600 | $68,760 |
| 2016 | $2,950 | $75,400 | $15,600 | $59,800 |
| 2015 | $2,775 | $69,520 | $11,600 | $57,920 |
| 2014 | -- | $59,360 | $11,600 | $47,760 |
Seller's Agent in 2022
Phuong Ai Liu
Virtual Properties Realty.com
(678) 936-5825
3 in this area
28 Total Sales
Landlord's Agent in 2022
Sophie Xie
Vistaray USA, Inc.
(770) 268-0728
1 in this area
7 Total Sales
Tenant's Agent in 2022
Vipul Patel
Trend Atlanta Realty, Inc.
(678) 480-3737
3 in this area
34 Total Sales
Seller's Agent in 2019
Tuyen Luong
Simply Homes ATL, LLC
(678) 707-3420
5 in this area
138 Total Sales
Seller's Agent in 2012
Larissa Benson
RE/MAX
(678) 730-7111
39 Total Sales
Seller's Agent in 2012
vu nguyen
Vu Nguyen Realty Atlanta LLC
(404) 512-1882
2 in this area
132 Total Sales
Source: First Multiple Listing Service (FMLS)
MLS Number: 7086061
APN: 7-185-250
![]() Listings identified with the FMLS IDX logo come from FMLS and are held by brokerage firms other than the owner of this website. The listing brokerage is identified in any listing details. Information is deemed reliable but is not guaranteed. If you believe any FMLS listing contains material that infringes your copyrighted work please visit www.fmls.com/dmca to review our DMCA policy and learn how to submit a takedown request. © 2026 First Multiple Listing Service, Inc.
Listings identified with the FMLS IDX logo come from FMLS and are held by brokerage firms other than the owner of this website. The listing brokerage is identified in any listing details. Information is deemed reliable but is not guaranteed. If you believe any FMLS listing contains material that infringes your copyrighted work please visit www.fmls.com/dmca to review our DMCA policy and learn how to submit a takedown request. © 2026 First Multiple Listing Service, Inc.
Disclaimer: Certain information contained herein is derived from information provided by parties other than Homes.com. All information provided is deemed reliable, but is not guaranteed to be accurate and should be independently verified.
Ask me questions while you tour the home.