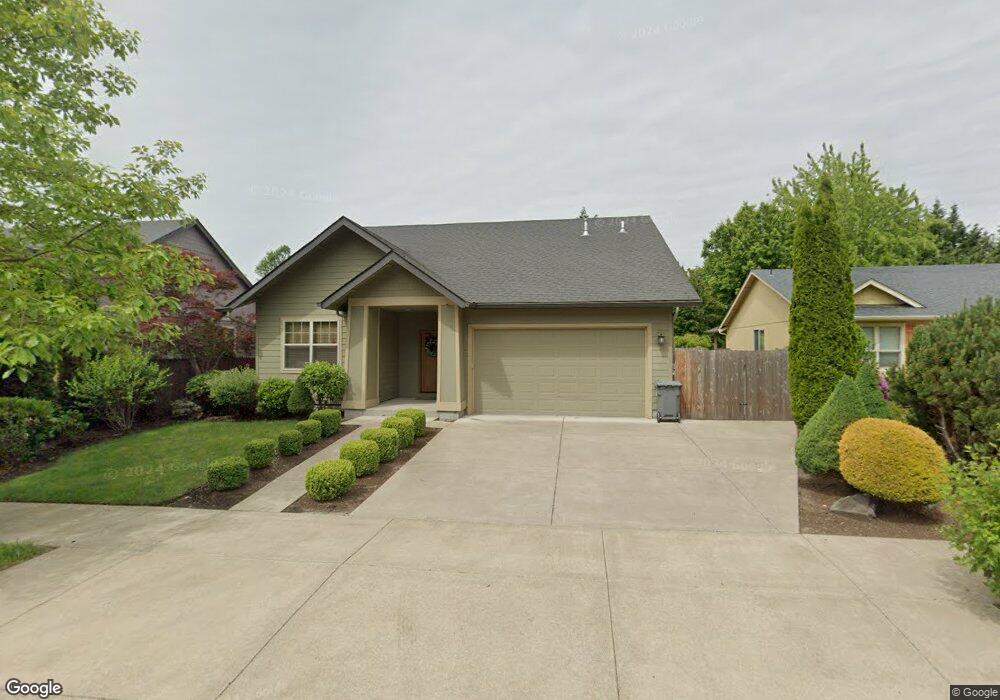
3520 Stark St Eugene, OR 97404
Santa Clara NeighborhoodEstimated Value: $452,000 - $521,000
3
Beds
2
Baths
1,505
Sq Ft
$324/Sq Ft
Est. Value
About This Home
This home is located at 3520 Stark St, Eugene, OR 97404 and is currently estimated at $487,233, approximately $323 per square foot. 3520 Stark St is a home located in Lane County with nearby schools including Irving Elementary School, Shasta Middle School, and Willamette High School.
Ownership History
Date
Name
Owned For
Owner Type
Purchase Details
Closed on
Mar 25, 2015
Sold by
Brannan Amy C and Ritter Bardford A
Bought by
Holley Benjamin and Holley Patricia
Current Estimated Value
Home Financials for this Owner
Home Financials are based on the most recent Mortgage that was taken out on this home.
Original Mortgage
$224,000
Outstanding Balance
$166,626
Interest Rate
3%
Mortgage Type
Adjustable Rate Mortgage/ARM
Estimated Equity
$320,607
Purchase Details
Closed on
May 23, 2012
Sold by
Brannan Amy C
Bought by
Brannan Amy C and Ritter Bradford A
Purchase Details
Closed on
Feb 27, 2012
Sold by
Greenleaf Properties Llc
Bought by
Brannan Amy C
Home Financials for this Owner
Home Financials are based on the most recent Mortgage that was taken out on this home.
Original Mortgage
$191,800
Interest Rate
3.83%
Mortgage Type
New Conventional
Purchase Details
Closed on
Dec 23, 2009
Sold by
Spring Brook Llc
Bought by
Debriae Jerry
Purchase Details
Closed on
Oct 21, 2009
Sold by
Spooky Hollow Llc
Bought by
Spring Brook Llc
Create a Home Valuation Report for This Property
The Home Valuation Report is an in-depth analysis detailing your home's value as well as a comparison with similar homes in the area
Home Values in the Area
Average Home Value in this Area
Purchase History
| Date | Buyer | Sale Price | Title Company |
|---|---|---|---|
| Holley Benjamin | $280,000 | Cascade Title Company | |
| Brannan Amy C | -- | Accommodation | |
| Brannan Amy C | $239,750 | Western Title & Escrow | |
| Debriae Jerry | $545,000 | Cascade Title Co | |
| Spring Brook Llc | -- | None Available |
Source: Public Records
Mortgage History
| Date | Status | Borrower | Loan Amount |
|---|---|---|---|
| Open | Holley Benjamin | $224,000 | |
| Previous Owner | Brannan Amy C | $191,800 |
Source: Public Records
Tax History
| Year | Tax Paid | Tax Assessment Tax Assessment Total Assessment is a certain percentage of the fair market value that is determined by local assessors to be the total taxable value of land and additions on the property. | Land | Improvement |
|---|---|---|---|---|
| 2025 | $4,800 | $275,937 | -- | -- |
| 2024 | $4,679 | $267,900 | -- | -- |
| 2023 | $4,679 | $260,098 | $0 | $0 |
| 2022 | $4,355 | $252,523 | $0 | $0 |
| 2021 | $4,263 | $245,168 | $0 | $0 |
| 2020 | $4,139 | $238,028 | $0 | $0 |
| 2019 | $3,936 | $231,096 | $0 | $0 |
| 2018 | $3,826 | $217,831 | $0 | $0 |
| 2017 | $3,656 | $217,831 | $0 | $0 |
| 2016 | $3,563 | $211,486 | $0 | $0 |
| 2015 | $3,493 | $205,326 | $0 | $0 |
| 2014 | $3,440 | $199,346 | $0 | $0 |
Source: Public Records
Map
Nearby Homes
- 591 Argon Ave
- 709 Tyson Ln
- 1133 Irvington Dr
- 3256 Marvin Dr
- 3985 Shenstone Dr
- 374 Blackfoot Ave
- 420 Lynnbrook Dr
- 212 Chimney Rock Ln
- 3365 Goose Cross Ln
- 4278 Torrington Ave
- 579 Sweetwater Ln
- 2987 Dry Creek Rd
- 47 van Fossen Ct
- 3470 Cabernet Ln
- 1256 Frogs Leap Ln
- 329 Dean Ave
- 1265 Napa Creek Dr
- 4490 Doyle St
- 2965 Teal Place
- 355 River Loop 2
Your Personal Tour Guide
Ask me questions while you tour the home.