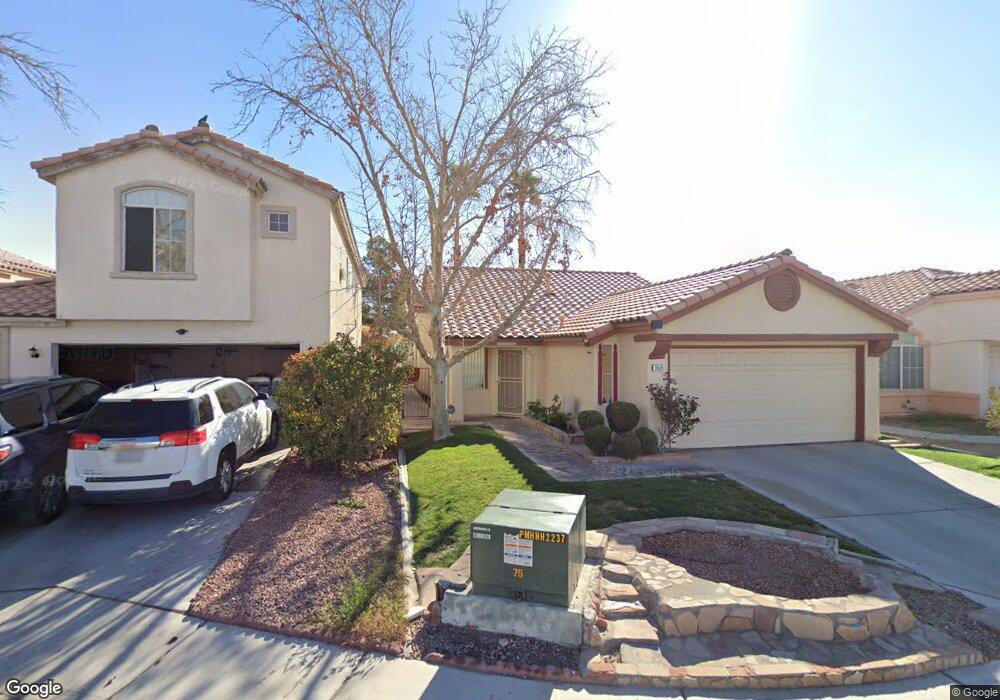
3520 Summerday Ct Las Vegas, NV 89147
Estimated Value: $381,522 - $396,000
3
Beds
2
Baths
1,220
Sq Ft
$321/Sq Ft
Est. Value
About This Home
This home is located at 3520 Summerday Ct, Las Vegas, NV 89147 and is currently estimated at $391,381, approximately $320 per square foot. 3520 Summerday Ct is a home located in Clark County with nearby schools including Roger M Bryan Elementary School, Clifford J Lawrence Junior High School, and Spring Valley High School.
Ownership History
Date
Name
Owned For
Owner Type
Purchase Details
Closed on
Sep 29, 2021
Sold by
Bennion Breck L and Bennion Family Trust
Bought by
Haggett Blake and Haggett Mackenzie
Current Estimated Value
Home Financials for this Owner
Home Financials are based on the most recent Mortgage that was taken out on this home.
Original Mortgage
$265,500
Outstanding Balance
$242,111
Interest Rate
2.8%
Mortgage Type
New Conventional
Estimated Equity
$149,270
Purchase Details
Closed on
Aug 17, 2016
Sold by
Bennion Boyd B and Bennion Margharet S
Bought by
Bennion Bruce B and Bennion Margaret S
Purchase Details
Closed on
Jul 1, 2009
Sold by
Bennion Boyd B and Bennion Margaret S
Bought by
Bennion Boyd B and Bennion Margaret S
Purchase Details
Closed on
Jan 18, 1994
Sold by
Lewis Homes Of Nevada
Bought by
Bennion B Bruce and Bennion Margaret S
Create a Home Valuation Report for This Property
The Home Valuation Report is an in-depth analysis detailing your home's value as well as a comparison with similar homes in the area
Home Values in the Area
Average Home Value in this Area
Purchase History
| Date | Buyer | Sale Price | Title Company |
|---|---|---|---|
| Haggett Blake | $295,000 | Chicago Title Corporate C | |
| Bennion Bruce B | -- | None Available | |
| Bennion Boyd B | -- | None Available | |
| Bennion B Bruce | $104,000 | Old Republic Title Co |
Source: Public Records
Mortgage History
| Date | Status | Borrower | Loan Amount |
|---|---|---|---|
| Open | Haggett Blake | $265,500 |
Source: Public Records
Tax History Compared to Growth
Tax History
| Year | Tax Paid | Tax Assessment Tax Assessment Total Assessment is a certain percentage of the fair market value that is determined by local assessors to be the total taxable value of land and additions on the property. | Land | Improvement |
|---|---|---|---|---|
| 2025 | $1,634 | $81,155 | $37,100 | $44,055 |
| 2024 | $1,514 | $81,155 | $37,100 | $44,055 |
| 2023 | $1,514 | $74,265 | $32,200 | $42,065 |
| 2022 | $1,402 | $65,893 | $27,300 | $38,593 |
| 2021 | $1,298 | $59,220 | $22,400 | $36,820 |
| 2020 | $1,257 | $58,714 | $22,050 | $36,664 |
| 2019 | $1,221 | $57,582 | $21,350 | $36,232 |
| 2018 | $1,185 | $51,839 | $16,800 | $35,039 |
| 2017 | $1,464 | $49,929 | $14,350 | $35,579 |
| 2016 | $1,123 | $48,419 | $12,600 | $35,819 |
| 2015 | $1,120 | $46,296 | $11,550 | $34,746 |
| 2014 | $1,088 | $35,976 | $9,100 | $26,876 |
Source: Public Records
Map
Nearby Homes
- 3637 Pinnate Dr
- 8003 Retriever Ave
- 3634 Surfboard Ct
- 3685 Springbud Dr
- 3508 Harbor Tides St
- 3440 Meridale Dr
- 8109 Retriever Ave
- 3372 Ceremony Dr
- 7938 Angel Tree Ct
- 7968 Dinsmore Dr
- 3749 Climbing Rose St
- 8139 Retriever Ave
- 3359 Commendation Dr
- 8143 Retriever Ave
- 3722 Violet Rose Ct
- 7954 Kentshire Dr
- 8064 Kentshire Dr
- 8153 Dinsmore Dr
- 7959 Palace Monaco Ave
- 7929 Palace Monaco Ave
- 3512 Summerday Ct
- 3528 Summerday Ct
- 3536 Summerday Ct
- 3504 Summerday Ct
- 3521 Spring Vistas Dr
- 3511 Spring Vistas Dr
- 3529 Spring Vistas Dr
- 3544 Summerday Ct
- 3505 Spring Vistas Dr
- 3537 Spring Vistas Dr
- 3517 Summerday Ct
- 3525 Summerday Ct
- 3507 Summerday Ct
- 3545 Spring Vistas Dr
- 3501 Summerday Ct
- 3552 Summerday Ct
- 3533 Summerday Ct
- 3553 Spring Vistas Dr
- 3541 Summerday Ct
- 3541 Summerday Ct