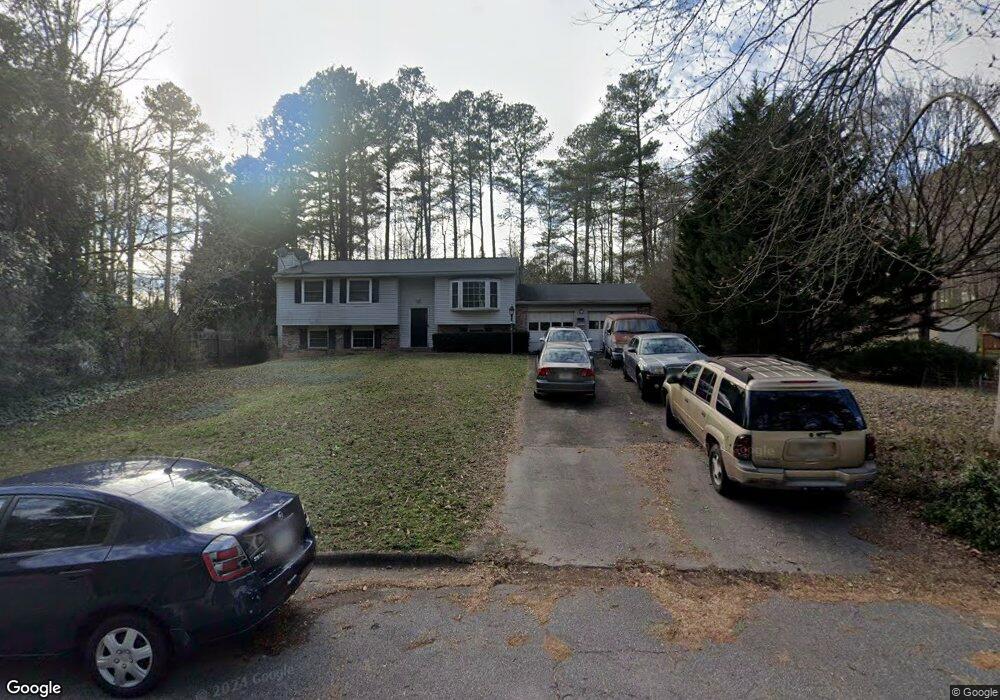
3521 Citrus Dr Duluth, GA 30096
Estimated Value: $367,000 - $379,000
3
Beds
2
Baths
1,028
Sq Ft
$364/Sq Ft
Est. Value
About This Home
This home is located at 3521 Citrus Dr, Duluth, GA 30096 and is currently estimated at $373,961, approximately $363 per square foot. 3521 Citrus Dr is a home located in Gwinnett County with nearby schools including B.B. Harris Elementary School, Duluth Middle School, and Duluth High School.
Ownership History
Date
Name
Owned For
Owner Type
Purchase Details
Closed on
Oct 27, 2022
Sold by
Hariprasad Maharanie
Bought by
Hariprasad Maharanie and Hariprasad Brandon Samantha
Current Estimated Value
Purchase Details
Closed on
Jan 7, 2008
Sold by
Deochand Chater P
Bought by
Hariprasad Maharanie
Home Financials for this Owner
Home Financials are based on the most recent Mortgage that was taken out on this home.
Original Mortgage
$85,500
Interest Rate
6.15%
Mortgage Type
New Conventional
Purchase Details
Closed on
Aug 13, 1999
Sold by
Dhanani Karim and Dhanani Dianne D
Bought by
Deochand Chater P
Home Financials for this Owner
Home Financials are based on the most recent Mortgage that was taken out on this home.
Original Mortgage
$89,600
Interest Rate
7.27%
Mortgage Type
New Conventional
Purchase Details
Closed on
Mar 29, 1996
Sold by
Anderson Rodney E
Bought by
Dhanani Karim Dianne D
Create a Home Valuation Report for This Property
The Home Valuation Report is an in-depth analysis detailing your home's value as well as a comparison with similar homes in the area
Home Values in the Area
Average Home Value in this Area
Purchase History
| Date | Buyer | Sale Price | Title Company |
|---|---|---|---|
| Hariprasad Maharanie | -- | -- | |
| Hariprasad Maharanie | $90,000 | -- | |
| Deochand Chater P | $112,000 | -- | |
| Dhanani Karim Dianne D | $85,000 | -- |
Source: Public Records
Mortgage History
| Date | Status | Borrower | Loan Amount |
|---|---|---|---|
| Previous Owner | Hariprasad Maharanie | $85,500 | |
| Previous Owner | Deochand Chater P | $89,600 | |
| Closed | Dhanani Karim Dianne D | $0 |
Source: Public Records
Tax History Compared to Growth
Tax History
| Year | Tax Paid | Tax Assessment Tax Assessment Total Assessment is a certain percentage of the fair market value that is determined by local assessors to be the total taxable value of land and additions on the property. | Land | Improvement |
|---|---|---|---|---|
| 2025 | $4,826 | $142,600 | $27,880 | $114,720 |
| 2024 | $4,877 | $128,160 | $28,800 | $99,360 |
| 2023 | $4,877 | $113,600 | $22,000 | $91,600 |
| 2022 | $4,326 | $113,600 | $22,000 | $91,600 |
| 2021 | $3,229 | $81,440 | $16,000 | $65,440 |
| 2020 | $3,247 | $81,440 | $16,000 | $65,440 |
| 2019 | $2,925 | $75,520 | $14,800 | $60,720 |
| 2018 | $2,480 | $62,840 | $14,800 | $48,040 |
| 2016 | $2,082 | $50,960 | $12,000 | $38,960 |
| 2015 | $1,853 | $43,880 | $8,000 | $35,880 |
| 2014 | $1,857 | $43,760 | $8,000 | $35,760 |
Source: Public Records
Map
Nearby Homes
- 3576 Randy Place
- 2644 Davenport Rd
- 2702 Davenport Rd
- 3518 Tracey Dr
- 2590 Village Place Dr
- 2961 Creek Dr
- 2638 Village Park Bend
- 3412 Davenport Park Ln
- 3576 Highland Pine Way
- 2888 Cardinal Trace
- 2829 Cardinal Trace
- 2995 Oxwell Dr Unit 1
- 3053 Hartright Bend Ct
- 3289 Davenport Park Ln
- 3190 Oxwell Dr
- 3215 Oxwell Dr Unit 1B
- 4172 Howell Park Rd
- 3980 Howell Park Rd
- 3593 Gainesway Ct
- 2830 Meadow Lake Trail
- 3525 Citrus Dr
- 2754 Lime Ct
- 2764 Lime Ct
- 3529 Citrus Dr
- 3518 Citrus Dr
- 2774 Lime Ct
- 3540 Citrus Dr
- 3514 Citrus Dr
- 2771 NE Citrus Dr
- 3537 Citrus Dr
- 3509 Citrus Dr
- 3510 Citrus Dr
- 3541 Citrus Dr
- 3545 Citrus Dr
- 3550 Citrus Dr
- 3506 Citrus Dr
- 3554 Citrus Dr
- 3549 Citrus Dr
- 3553 Citrus Dr NW
- 3502 Citrus Dr NW