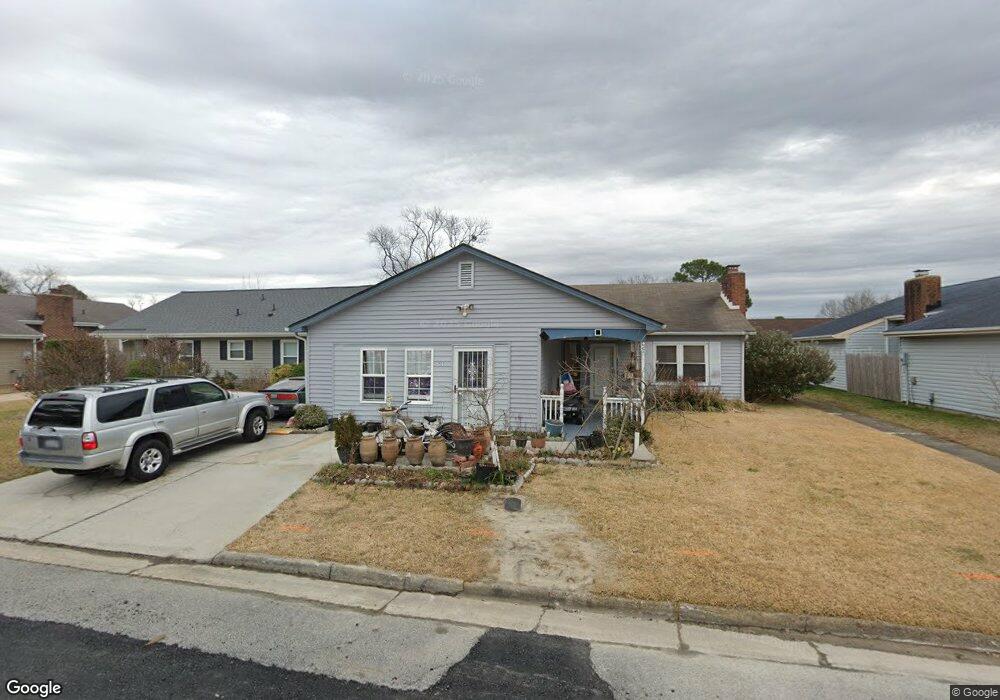
3521 Dandelion Crescent Virginia Beach, VA 23453
Green Run NeighborhoodEstimated Value: $337,311 - $359,000
3
Beds
2
Baths
1,400
Sq Ft
$246/Sq Ft
Est. Value
About This Home
This home is located at 3521 Dandelion Crescent, Virginia Beach, VA 23453 and is currently estimated at $344,828, approximately $246 per square foot. 3521 Dandelion Crescent is a home located in Virginia Beach City with nearby schools including Green Run Elementary School, Larkspur Middle School, and Green Run High School.
Ownership History
Date
Name
Owned For
Owner Type
Purchase Details
Closed on
Jun 23, 2008
Sold by
Rabi Nissan
Bought by
Hart Julie
Current Estimated Value
Home Financials for this Owner
Home Financials are based on the most recent Mortgage that was taken out on this home.
Original Mortgage
$202,500
Outstanding Balance
$130,275
Interest Rate
6.1%
Mortgage Type
New Conventional
Estimated Equity
$214,553
Purchase Details
Closed on
Mar 31, 2008
Sold by
Windes Bradley A
Bought by
Rabi Nissan
Purchase Details
Closed on
Apr 28, 2005
Sold by
Good Idea Inc
Bought by
Higgs Elizabeth R
Home Financials for this Owner
Home Financials are based on the most recent Mortgage that was taken out on this home.
Original Mortgage
$157,400
Interest Rate
5.79%
Mortgage Type
New Conventional
Purchase Details
Closed on
Jan 31, 2005
Sold by
Reed Giles
Bought by
Good Idea Inc
Create a Home Valuation Report for This Property
The Home Valuation Report is an in-depth analysis detailing your home's value as well as a comparison with similar homes in the area
Home Values in the Area
Average Home Value in this Area
Purchase History
| Date | Buyer | Sale Price | Title Company |
|---|---|---|---|
| Hart Julie | $225,000 | -- | |
| Rabi Nissan | $181,000 | -- | |
| Higgs Elizabeth R | $226,967 | -- | |
| Good Idea Inc | $120,000 | -- |
Source: Public Records
Mortgage History
| Date | Status | Borrower | Loan Amount |
|---|---|---|---|
| Open | Hart Julie | $202,500 | |
| Previous Owner | Higgs Elizabeth R | $157,400 |
Source: Public Records
Tax History Compared to Growth
Tax History
| Year | Tax Paid | Tax Assessment Tax Assessment Total Assessment is a certain percentage of the fair market value that is determined by local assessors to be the total taxable value of land and additions on the property. | Land | Improvement |
|---|---|---|---|---|
| 2025 | -- | $291,900 | $115,000 | $176,900 |
| 2024 | $2,732 | $276,000 | $110,000 | $166,000 |
| 2023 | $2,579 | $260,500 | $105,000 | $155,500 |
| 2022 | $2,485 | $251,000 | $95,000 | $156,000 |
| 2021 | $2,183 | $220,500 | $85,000 | $135,500 |
| 2020 | $2,163 | $212,600 | $85,000 | $127,600 |
| 2019 | $2,056 | $200,100 | $78,000 | $122,100 |
| 2018 | $2,006 | $200,100 | $78,000 | $122,100 |
| 2017 | $1,976 | $197,100 | $75,000 | $122,100 |
| 2016 | $1,912 | $193,100 | $71,000 | $122,100 |
| 2015 | $1,856 | $187,500 | $71,000 | $116,500 |
| 2014 | $1,806 | $191,000 | $88,200 | $102,800 |
Source: Public Records
Map
Nearby Homes
- 3540 Dandelion Crescent
- 3721 Northwood Ct
- 3529 Plum Crescent
- 1338 Sierra Dr
- 1368 Sierra Dr
- 3403 Dandelion Crescent
- 1384 Sierra Dr
- 1392 Sierra Dr
- 3429 Plum Crescent
- 3684 Windmill Dr
- 1205 Geranium Crescent
- 1236 Ginger Crescent
- 3544 Campion Ave
- 3416 Crimson Holly Ct
- 3707 Sylvan Ln
- 3309 Weeping Willow Ln
- 1457 Ski Lodge Rd
- 3849 Sweetbriar Ct
- 1201 Green Cedar Ln
- 3301 Sugar Creek Dr
- 3517 Dandelion Crescent
- 3525 Dandelion Crescent
- 3520 Daffodil Crescent
- 3513 Dandelion Crescent
- 3524 Daffodil Crescent
- 3529 Dandelion Crescent
- 3516 Daffodil Crescent
- 3520 Dandelion Crescent
- 3528 Daffodil Crescent
- 3512 Daffodil Crescent
- 3512 Dandelion Crescent
- 3533 Dandelion Crescent
- 3524 Dandelion Crescent
- 3508 Dandelion Crescent
- 3532 Daffodil Crescent
- 3508 Daffodil Crescent
- 3528 Dandelion Crescent
- 3505 Dandelion Crescent
- 3504 Dandelion Crescent
- 3537 Dandelion Crescent