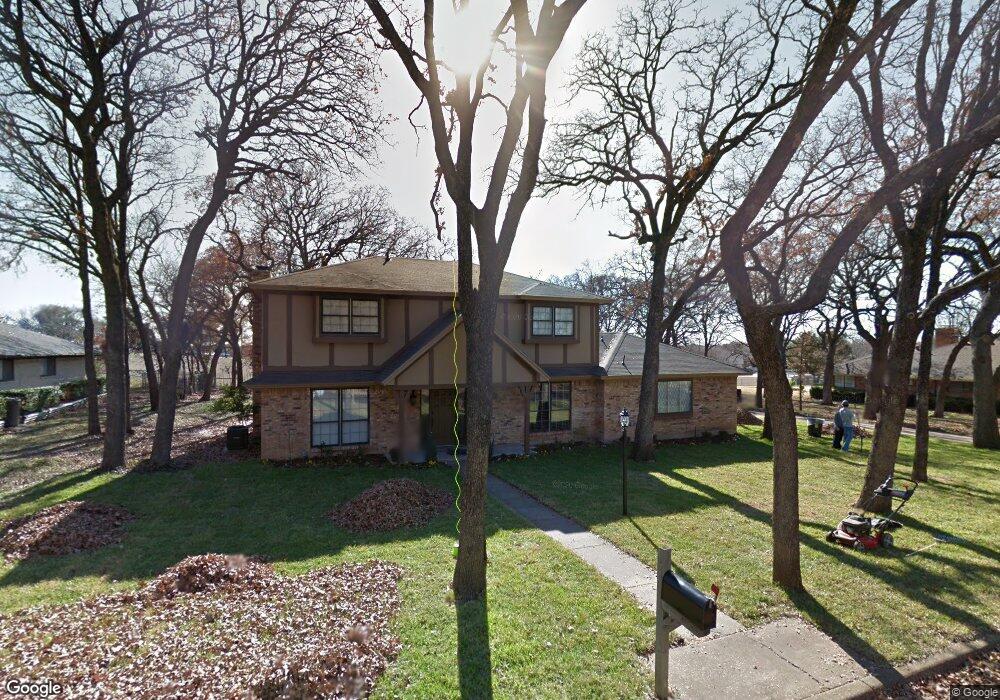
3521 Marsh Ln Grapevine, TX 76051
Estimated Value: $603,128 - $663,000
3
Beds
2
Baths
2,502
Sq Ft
$255/Sq Ft
Est. Value
About This Home
This home is located at 3521 Marsh Ln, Grapevine, TX 76051 and is currently estimated at $639,032, approximately $255 per square foot. 3521 Marsh Ln is a home located in Tarrant County with nearby schools including O.C. Taylor Elementary School, Cross Timbers Middle School, and Grapevine High School.
Ownership History
Date
Name
Owned For
Owner Type
Purchase Details
Closed on
Jun 3, 2022
Sold by
Grant Johnston Michael
Bought by
Johnston Michael Grant and Johnston Dani Gail
Current Estimated Value
Purchase Details
Closed on
Nov 17, 2020
Sold by
Egeland James Edward and Egeland Vanessa Marie
Bought by
Johnston Michael G and Johnston Dani G
Home Financials for this Owner
Home Financials are based on the most recent Mortgage that was taken out on this home.
Original Mortgage
$403,750
Interest Rate
2.8%
Mortgage Type
New Conventional
Purchase Details
Closed on
Oct 20, 2011
Sold by
Tk Homes Llc
Bought by
Egeland James Edward and Egeland Vanessa Marie
Purchase Details
Closed on
Jun 8, 2011
Sold by
Gordon Lloyd B and Gordon Edith J
Bought by
Tk Homes Llc
Create a Home Valuation Report for This Property
The Home Valuation Report is an in-depth analysis detailing your home's value as well as a comparison with similar homes in the area
Home Values in the Area
Average Home Value in this Area
Purchase History
| Date | Buyer | Sale Price | Title Company |
|---|---|---|---|
| Johnston Michael Grant | -- | None Listed On Document | |
| Johnston Michael G | -- | Texas Premier Title | |
| Egeland James Edward | -- | Old Republic Title | |
| Tk Homes Llc | -- | Old Republic Title |
Source: Public Records
Mortgage History
| Date | Status | Borrower | Loan Amount |
|---|---|---|---|
| Previous Owner | Johnston Michael G | $403,750 |
Source: Public Records
Tax History
| Year | Tax Paid | Tax Assessment Tax Assessment Total Assessment is a certain percentage of the fair market value that is determined by local assessors to be the total taxable value of land and additions on the property. | Land | Improvement |
|---|---|---|---|---|
| 2025 | $2,194 | $454,903 | $209,900 | $245,003 |
| 2024 | $2,194 | $454,903 | $209,900 | $245,003 |
| 2023 | $6,641 | $396,165 | $209,900 | $186,265 |
| 2022 | $7,546 | $380,899 | $209,900 | $170,999 |
| 2021 | $6,519 | $299,803 | $125,940 | $173,863 |
| 2020 | $6,631 | $308,320 | $125,940 | $182,380 |
| 2019 | $6,250 | $306,369 | $80,000 | $226,369 |
| 2018 | $1,481 | $249,163 | $80,000 | $169,163 |
| 2017 | $5,238 | $294,254 | $80,000 | $214,254 |
| 2016 | $4,762 | $289,940 | $80,000 | $209,940 |
| 2015 | $3,972 | $187,200 | $40,000 | $147,200 |
| 2014 | $3,972 | $187,200 | $40,000 | $147,200 |
Source: Public Records
Map
Nearby Homes
- 5809 N Ballantrae Dr
- 3509 Hightimber Dr
- 3233 High Meadow Dr
- 2618 Pointe Ct
- 3446 Spring Willow Dr
- 3904 Wagon Wheel Dr
- 4147 Cedar Dr
- 4150 Cedar Dr
- 4151 Cedar Dr
- 3206 Wintergreen Terrace
- 2902 Summertree Ln
- 2304 Woodmoor Ln
- 3205 Bridle Ln
- 3028 Mountainview Ct
- 3218 Mapleridge Dr
- 3020 Northview Dr
- 3502 Fieldwood St
- 3920 Kelsey Ct
- 3400 Wt Parr Rd
- 2817 Kingswood Dr
- 3511 Marsh Ln
- 3531 Marsh Ln
- 3522 Marsh Ln
- 3512 Marsh Ln
- 3532 Marsh Ln
- 3541 Marsh Ln
- 3502 Marsh Ln
- 3542 Marsh Ln
- 3829 Pool Rd
- 3441 Marsh Ln
- 3442 Marsh Ln
- 3509 Rolling Hills Ln
- 6230 Pool Rd
- 3503 Rolling Hills Ln
- 3431 Marsh Ln
- 2609 Highland Park Ct
- 2606 Highland Dr
- 3521 Rolling Hills Ln
- 3501 Rolling Hills Ln
- 3432 Marsh Ln
Your Personal Tour Guide
Ask me questions while you tour the home.