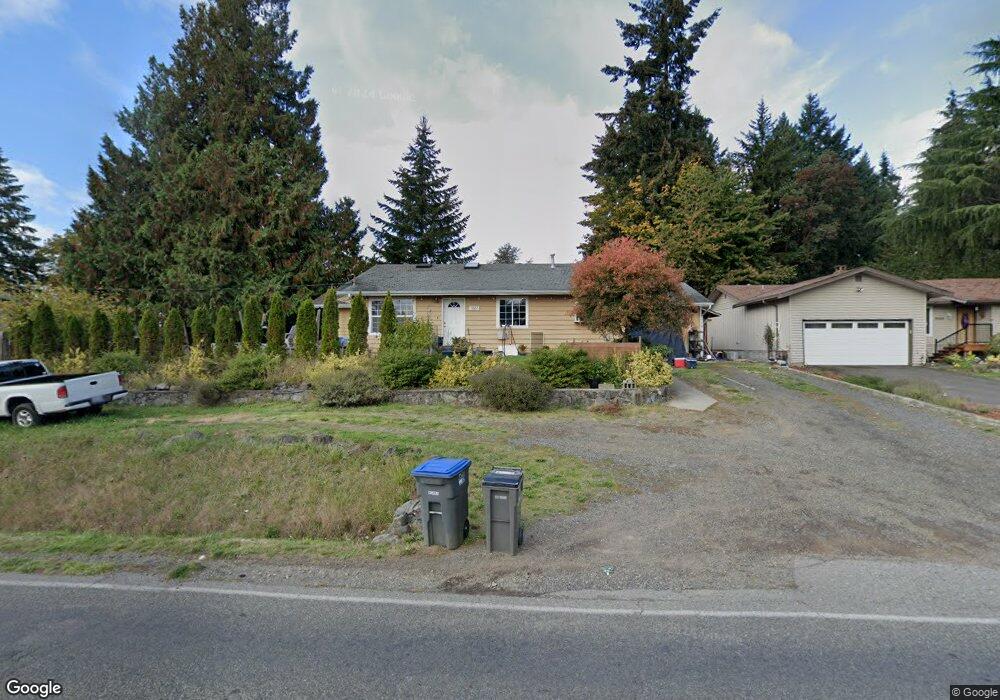
3521 Pine Rd NE Bremerton, WA 98310
Estimated Value: $417,000 - $478,000
3
Beds
2
Baths
1,596
Sq Ft
$273/Sq Ft
Est. Value
About This Home
This home is located at 3521 Pine Rd NE, Bremerton, WA 98310 and is currently estimated at $435,454, approximately $272 per square foot. 3521 Pine Rd NE is a home located in Kitsap County with nearby schools including Armin Jahr Elementary School, Mountain View Middle School, and Bremerton High School.
Ownership History
Date
Name
Owned For
Owner Type
Purchase Details
Closed on
Sep 26, 2000
Sold by
The Cit Group/Consumer Finance Inc
Bought by
Allen Michael S and Allen Nadine R
Current Estimated Value
Home Financials for this Owner
Home Financials are based on the most recent Mortgage that was taken out on this home.
Original Mortgage
$93,934
Outstanding Balance
$34,404
Interest Rate
7.98%
Mortgage Type
FHA
Estimated Equity
$401,050
Purchase Details
Closed on
Feb 11, 2000
Sold by
Pettis Richard Keith
Bought by
The Cit Group/Consumer Finance Inc
Purchase Details
Closed on
Dec 18, 1998
Sold by
Pettis Richard Keith and Pettis Catherine
Bought by
Pettis Richard Keith
Home Financials for this Owner
Home Financials are based on the most recent Mortgage that was taken out on this home.
Original Mortgage
$50,000
Interest Rate
6.91%
Create a Home Valuation Report for This Property
The Home Valuation Report is an in-depth analysis detailing your home's value as well as a comparison with similar homes in the area
Home Values in the Area
Average Home Value in this Area
Purchase History
| Date | Buyer | Sale Price | Title Company |
|---|---|---|---|
| Allen Michael S | $63,000 | First American Title Ins Co | |
| The Cit Group/Consumer Finance Inc | -- | Land Title Company | |
| Pettis Richard Keith | -- | Transnation Title Insurance |
Source: Public Records
Mortgage History
| Date | Status | Borrower | Loan Amount |
|---|---|---|---|
| Open | Allen Michael S | $93,934 | |
| Previous Owner | Pettis Richard Keith | $50,000 |
Source: Public Records
Tax History Compared to Growth
Tax History
| Year | Tax Paid | Tax Assessment Tax Assessment Total Assessment is a certain percentage of the fair market value that is determined by local assessors to be the total taxable value of land and additions on the property. | Land | Improvement |
|---|---|---|---|---|
| 2026 | $3,005 | $347,350 | $101,440 | $245,910 |
| 2025 | $3,005 | $347,350 | $101,440 | $245,910 |
| 2024 | $2,899 | $347,350 | $101,440 | $245,910 |
| 2023 | $2,997 | $347,350 | $101,440 | $245,910 |
| 2022 | $2,779 | $289,850 | $84,530 | $205,320 |
| 2021 | $2,911 | $278,080 | $56,340 | $221,740 |
| 2020 | $2,719 | $259,900 | $52,540 | $207,360 |
| 2019 | $2,359 | $234,190 | $47,210 | $186,980 |
| 2018 | $2,432 | $167,510 | $38,070 | $129,440 |
| 2017 | $2,142 | $167,510 | $38,070 | $129,440 |
| 2016 | $1,990 | $147,420 | $33,390 | $114,030 |
| 2015 | $1,807 | $133,230 | $33,820 | $99,410 |
| 2014 | -- | $128,010 | $33,820 | $94,190 |
| 2013 | -- | $136,480 | $36,200 | $100,280 |
Source: Public Records
Map
Nearby Homes
- 3835 Earendale Ave
- 3868 Pinecone Dr NE
- 802 Hanford Ave
- 638 Shirehill St
- 654 E 31st St
- 223 Alnus Way
- 937 Pearl St
- 414 E 31st St
- 3400 Narrows View Ln NE Unit 204
- 3560 Narrows View Ln NE Unit 5-201
- 3560 Narrows View Ln NE Unit 202
- 920 E 31st St
- 3023 Pawnee Dr
- 3340 Narrows View Ln NE Unit 103
- 3621 Wheaton Way
- 704 NE Normandy Dr
- 3347 Amak Ln
- 944 E 30th St
- 2916 Robin Ave
- 4 Sulphur Springs Ln
- 3525 Pine Rd NE
- 408 Pennie Ln
- 401 Pennie Ln
- 3506 Pine Rd NE
- 3522 Pine Rd NE
- 3509 Pine Rd NE
- 406 Pennie Ln
- 3529 Pine Rd NE
- 409 Pennie Ln
- 403 Pennie Ln
- 407 Pennie Ln
- 405 Pennie Ln
- 3505 Pine Rd NE
- 3542 Springbrook Ln
- 3504 Pine Rd NE
- 398 Gatestone Ct
- 3453 Pine Rd NE
- 690 Pearl Place Unit 6
- 690 Pearl Place
- 690 Pearl Place Unit 3