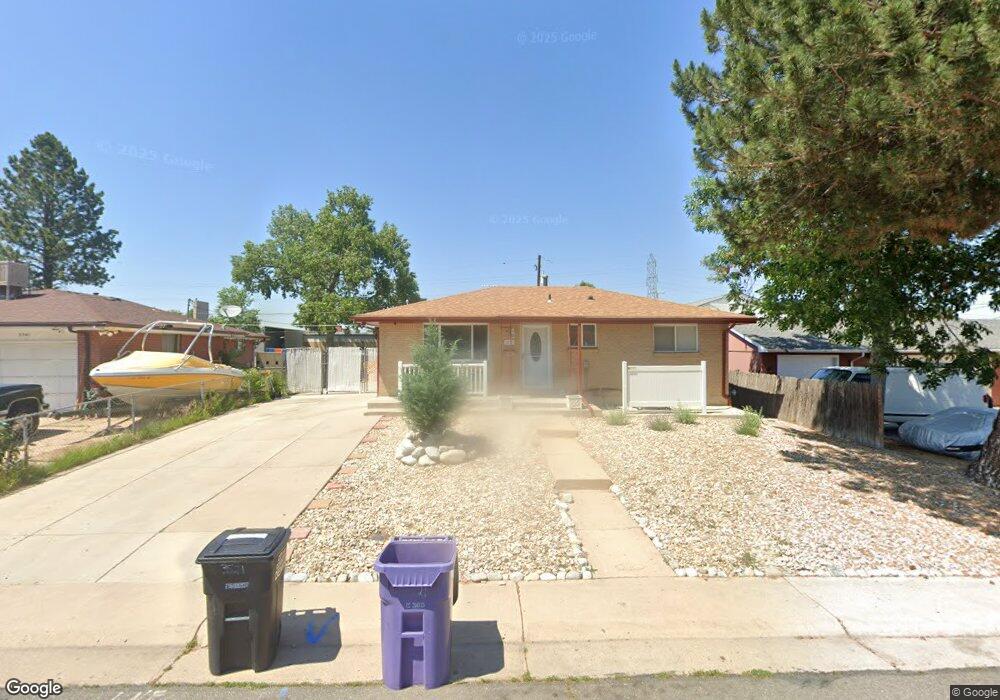
3521 W Hoye Place Denver, CO 80219
Westwood NeighborhoodEstimated Value: $466,000 - $491,000
4
Beds
2
Baths
1,888
Sq Ft
$253/Sq Ft
Est. Value
About This Home
This home is located at 3521 W Hoye Place, Denver, CO 80219 and is currently estimated at $477,425, approximately $252 per square foot. 3521 W Hoye Place is a home located in Denver County with nearby schools including Castro Elementary School, Kepner Beacon Middle School, and West High School.
Ownership History
Date
Name
Owned For
Owner Type
Purchase Details
Closed on
Aug 21, 2020
Sold by
Truong Ban and Nguyen Kally
Bought by
Jimenez Leonardo Leyva and Skadow Karen Jo
Current Estimated Value
Home Financials for this Owner
Home Financials are based on the most recent Mortgage that was taken out on this home.
Original Mortgage
$370,500
Outstanding Balance
$328,047
Interest Rate
2.9%
Mortgage Type
New Conventional
Estimated Equity
$149,378
Purchase Details
Closed on
May 17, 2012
Sold by
Vannguyen Thang and Nguyen Ly Lim
Bought by
Truong Ban and Nguyen Kally
Home Financials for this Owner
Home Financials are based on the most recent Mortgage that was taken out on this home.
Original Mortgage
$105,600
Interest Rate
4.02%
Mortgage Type
New Conventional
Purchase Details
Closed on
Aug 20, 1998
Sold by
Van Nguyen Thang and Lim Ly
Bought by
Vannguyen Thang and Nguyen Hai Tuan
Purchase Details
Closed on
Oct 4, 1993
Sold by
Gonzales Gilbert E and Gonzales Carol N
Bought by
Lim Nguyen Thang Van Ly
Create a Home Valuation Report for This Property
The Home Valuation Report is an in-depth analysis detailing your home's value as well as a comparison with similar homes in the area
Home Values in the Area
Average Home Value in this Area
Purchase History
| Date | Buyer | Sale Price | Title Company |
|---|---|---|---|
| Jimenez Leonardo Leyva | $390,000 | First Integrity Title Co | |
| Truong Ban | $137,000 | Fidelity National Title Insu | |
| Vannguyen Thang | $130,000 | -- | |
| Lim Nguyen Thang Van Ly | $86,000 | -- |
Source: Public Records
Mortgage History
| Date | Status | Borrower | Loan Amount |
|---|---|---|---|
| Open | Jimenez Leonardo Leyva | $370,500 | |
| Previous Owner | Truong Ban | $105,600 |
Source: Public Records
Tax History Compared to Growth
Tax History
| Year | Tax Paid | Tax Assessment Tax Assessment Total Assessment is a certain percentage of the fair market value that is determined by local assessors to be the total taxable value of land and additions on the property. | Land | Improvement |
|---|---|---|---|---|
| 2024 | $2,307 | $29,130 | $3,450 | $25,680 |
| 2023 | $2,257 | $29,130 | $3,450 | $25,680 |
| 2022 | $1,874 | $23,570 | $7,400 | $16,170 |
| 2021 | $1,874 | $24,250 | $7,610 | $16,640 |
| 2020 | $1,638 | $22,080 | $5,710 | $16,370 |
| 2019 | $1,592 | $22,080 | $5,710 | $16,370 |
| 2018 | $1,349 | $17,440 | $4,800 | $12,640 |
| 2017 | $1,345 | $17,440 | $4,800 | $12,640 |
| 2016 | $1,182 | $14,500 | $4,505 | $9,995 |
| 2015 | $1,133 | $14,500 | $4,505 | $9,995 |
| 2014 | $860 | $10,350 | $2,651 | $7,699 |
Source: Public Records
Map
Nearby Homes
- 3441 W Ford Place
- 1065 S Irving St Unit west half of lot 24
- 1057 S Osceola St
- 855 S Knox Ct
- 3503 W Ada Place
- 3918 W Kentucky Ave
- 1235 S Irving St
- 1200 S Patton Ct
- 1124 S Perry St
- 960 S Perry St
- 990 S Meade St
- 3470 W Walsh Place
- 1050 S Quitman St
- 1255 S Patton Ct
- 3703 W Walsh Place
- 1110 S Quitman St
- 3947 W Ohio Ave Unit 17
- 3145 W Ada Place
- 3245 W Walsh Place
- 668 S Lowell Blvd
- 3541 W Hoye Place
- 1045 S King St
- 1017 S King St
- 3561 W Hoye Place
- 3520 W Hoye Place
- 3540 W Hoye Place
- 3510 W Hoye Place
- 3581 W Hoye Place
- 3500 W Hoye Place
- 3495 W Hoye Place
- 1060 S Lowell Blvd
- 3490 W Hoye Place
- 3565 W Mississippi Ave
- 3535 W Mississippi Ave
- 3485 W Hoye Place
- 3595 W Mississippi Ave
- 3490 W Tennessee Ave
- 3480 W Hoye Place
- 3505 W Mississippi Ave
- 1037 S Lowell Blvd