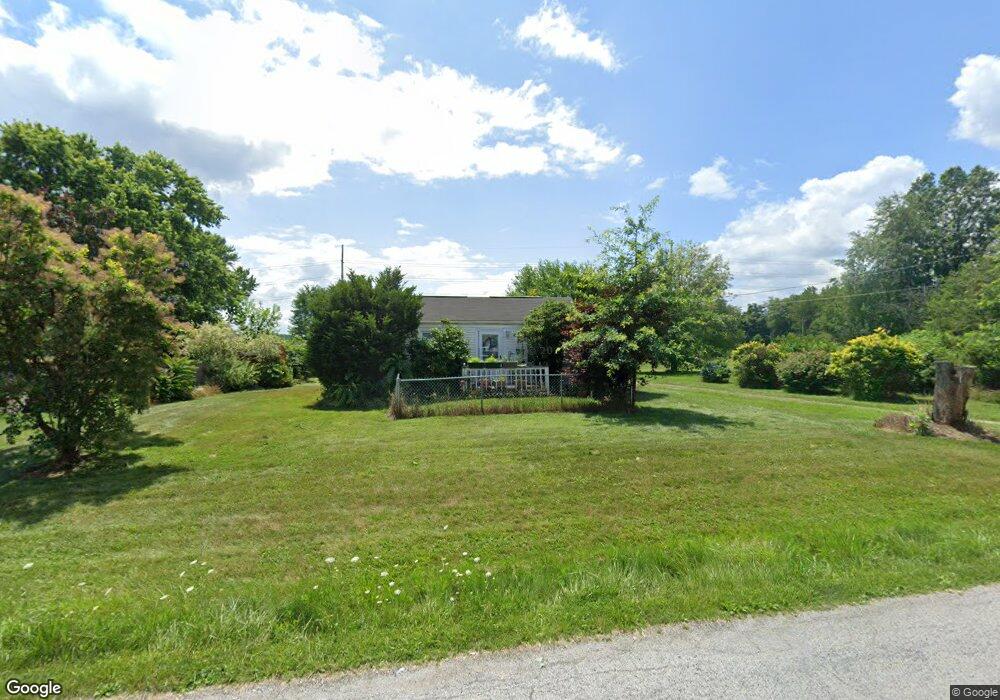
3522 39th St SW Canton, OH 44706
Estimated Value: $89,804 - $130,000
2
Beds
1
Bath
596
Sq Ft
$184/Sq Ft
Est. Value
About This Home
This home is located at 3522 39th St SW, Canton, OH 44706 and is currently estimated at $109,451, approximately $183 per square foot. 3522 39th St SW is a home located in Stark County with nearby schools including Faircrest Memorial Elementary School, Canton South High School, and Beacon Academy.
Ownership History
Date
Name
Owned For
Owner Type
Purchase Details
Closed on
Mar 11, 2010
Sold by
Fisher Robert R and Fisher Linda C
Bought by
Fisher Jessica D
Current Estimated Value
Purchase Details
Closed on
Dec 19, 2008
Sold by
Hsbc Bank Usa National Association
Bought by
Fisher Robert R
Purchase Details
Closed on
Jul 28, 2008
Sold by
Cottrell Jeffrey D
Bought by
Hsbc Bank Usa National Association
Purchase Details
Closed on
May 31, 2005
Sold by
Bowling Russell G and Bowling Michele A
Bought by
Cottrell Jeffrey D
Home Financials for this Owner
Home Financials are based on the most recent Mortgage that was taken out on this home.
Original Mortgage
$70,000
Interest Rate
7.25%
Mortgage Type
Fannie Mae Freddie Mac
Purchase Details
Closed on
Nov 12, 1996
Sold by
Sandor Doris J
Bought by
Bowling Russell G and Bowling Michele
Create a Home Valuation Report for This Property
The Home Valuation Report is an in-depth analysis detailing your home's value as well as a comparison with similar homes in the area
Home Values in the Area
Average Home Value in this Area
Purchase History
| Date | Buyer | Sale Price | Title Company |
|---|---|---|---|
| Fisher Jessica D | -- | Attorney | |
| Fisher Robert R | $19,900 | Resource Title Agency Inc | |
| Hsbc Bank Usa National Association | $46,000 | None Available | |
| Cottrell Jeffrey D | $70,000 | Lawyers Title Insurance Corp | |
| Bowling Russell G | $22,000 | -- |
Source: Public Records
Mortgage History
| Date | Status | Borrower | Loan Amount |
|---|---|---|---|
| Previous Owner | Cottrell Jeffrey D | $70,000 |
Source: Public Records
Tax History Compared to Growth
Tax History
| Year | Tax Paid | Tax Assessment Tax Assessment Total Assessment is a certain percentage of the fair market value that is determined by local assessors to be the total taxable value of land and additions on the property. | Land | Improvement |
|---|---|---|---|---|
| 2025 | -- | $29,050 | $17,640 | $11,410 |
| 2024 | -- | $29,050 | $17,640 | $11,410 |
| 2023 | $987 | $21,850 | $11,870 | $9,980 |
| 2022 | $917 | $21,850 | $11,870 | $9,980 |
| 2021 | $921 | $21,850 | $11,870 | $9,980 |
| 2020 | $879 | $18,310 | $10,050 | $8,260 |
| 2019 | $892 | $18,310 | $10,050 | $8,260 |
| 2018 | $885 | $18,310 | $10,050 | $8,260 |
| 2017 | $847 | $16,530 | $9,350 | $7,180 |
| 2016 | $848 | $16,530 | $9,350 | $7,180 |
| 2015 | $931 | $18,140 | $9,840 | $8,300 |
| 2014 | $861 | $15,750 | $8,540 | $7,210 |
| 2013 | $405 | $15,750 | $8,540 | $7,210 |
Source: Public Records
Map
Nearby Homes
- 3463 Shepler Church Ave SW
- 3223 Dueber Ave SW
- 1550 Rebel St SW
- 1521 Bravado Rd SW
- 4314 Millport Ave SW
- 0 Sherman Church Ave SW
- 3903 Richville Dr SW
- 2802 Rexdale St SW
- 4981 Whipple Ave SW
- 5001 Sherman Church Ave SW
- 3245 Sierra Ave SW
- 2425 Bordner Ave SW
- 711 Somerset Ave SW
- 2918 17th St SW
- 0 20th St SW
- 1712 Clarendon Ave SW
- 1815 Vine Ave SW
- 4400 Eddie Ave SW
- 312 28th St SW
- 236 32nd St SW
- 3512 39th St SW
- 3527 39th St SW
- 3614 39th St SW
- 3500 39th St SW
- 3500 39th St SW
- 3511 39th St SW
- 3607 39th St SW
- 3501 39th St SW
- 3922 Sherman Church Ave SW
- 3423 39th St SW
- 3413 39th St SW
- 3404 39th St SW
- 3808 Sherman Church Ave SW
- 3424 38th St SW
- 3401 39th St SW
- 3401 39th St SW
- 3833 Sherman Church Ave SW
- 3414 38th St SW
- V/L 38th St SW
- 3811 Sherman Church Ave SW