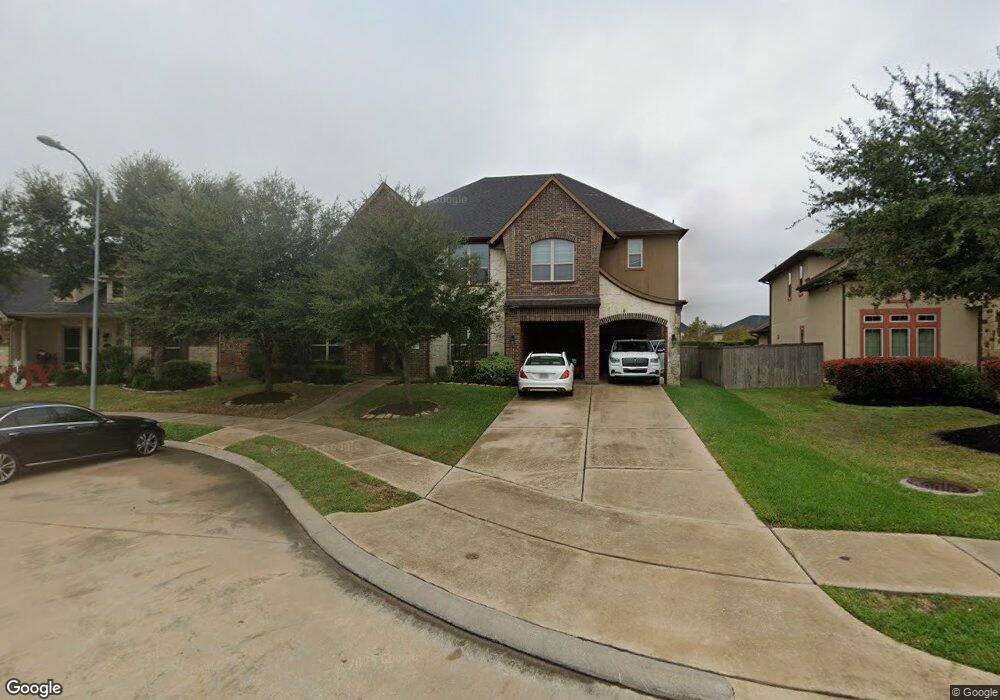
3522 Grayson Gardens Ct Fulshear, TX 77441
Estimated Value: $690,000 - $762,553
5
Beds
5
Baths
5,037
Sq Ft
$144/Sq Ft
Est. Value
About This Home
This home is located at 3522 Grayson Gardens Ct, Fulshear, TX 77441 and is currently estimated at $727,138, approximately $144 per square foot. 3522 Grayson Gardens Ct is a home located in Fort Bend County with nearby schools including Campbell Elementary School, Joe M. Adams Junior High, and Sugar Creek Montessori - Fulshear/West Katy.
Ownership History
Date
Name
Owned For
Owner Type
Purchase Details
Closed on
Jul 23, 2023
Sold by
Tachie Menson Eva and Tachie Gladys Tachie-Menson
Bought by
3522 Grayson Garden Trust
Current Estimated Value
Purchase Details
Closed on
Oct 10, 2016
Sold by
Menson Eva Tachie
Bought by
Menson Gladys Tachie
Purchase Details
Closed on
Jun 30, 2014
Sold by
Beazer Homes Texas Lp
Bought by
Tachie Menson Eva
Home Financials for this Owner
Home Financials are based on the most recent Mortgage that was taken out on this home.
Original Mortgage
$46,246
Interest Rate
4.18%
Mortgage Type
Stand Alone Second
Purchase Details
Closed on
May 1, 2013
Sold by
Taylor Morrison Of Texas Inc
Bought by
Menson Eva Tachie and Gladys Tachie-Menson
Create a Home Valuation Report for This Property
The Home Valuation Report is an in-depth analysis detailing your home's value as well as a comparison with similar homes in the area
Home Values in the Area
Average Home Value in this Area
Purchase History
| Date | Buyer | Sale Price | Title Company |
|---|---|---|---|
| 3522 Grayson Garden Trust | -- | None Listed On Document | |
| Menson Gladys Tachie | -- | None Available | |
| Menson Eva Tachie | -- | -- | |
| Tachie Menson Eva | -- | First American Title | |
| Menson Eva Tachie | -- | -- | |
| Menson Eva Tachie | -- | -- |
Source: Public Records
Mortgage History
| Date | Status | Borrower | Loan Amount |
|---|---|---|---|
| Previous Owner | Menson Eva Tachie | $46,246 | |
| Previous Owner | Menson Eva Tachie | $369,960 |
Source: Public Records
Tax History Compared to Growth
Tax History
| Year | Tax Paid | Tax Assessment Tax Assessment Total Assessment is a certain percentage of the fair market value that is determined by local assessors to be the total taxable value of land and additions on the property. | Land | Improvement |
|---|---|---|---|---|
| 2025 | $17,036 | $697,506 | $99,966 | $597,540 |
| 2024 | $17,036 | $701,720 | $99,966 | $601,754 |
| 2023 | $6,940 | $579,281 | $0 | $596,373 |
| 2022 | $8,294 | $562,130 | $76,900 | $485,230 |
| 2021 | $12,804 | $445,450 | $76,900 | $368,550 |
| 2020 | $12,974 | $442,500 | $77,000 | $365,500 |
| 2019 | $14,198 | $453,520 | $77,000 | $376,520 |
| 2018 | $13,518 | $431,110 | $77,000 | $354,110 |
| 2017 | $13,710 | $436,540 | $77,000 | $359,540 |
| 2016 | $14,263 | $454,140 | $77,000 | $377,140 |
| 2015 | $9,598 | $456,460 | $77,000 | $379,460 |
| 2014 | $2,018 | $95,560 | $64,260 | $31,300 |
Source: Public Records
Map
Nearby Homes
- 3422 Walker Falls Ln
- 27603 Huggins Crest Ct
- 3438 Cartwright Cliff Ln
- 27514 Wilson Run Ln
- 28131 Twin Knolls Ln
- 27423 Sunrise Ranch Ln
- 27419 Canyon Reach Dr
- 27411 Canyon Reach Dr
- 27414 Wooded Canyon Dr
- 27830 Hunters Rock Ln
- 27415 Royal Canyon Ln
- 3314 Flint Valley Ln
- 27834 Hunters Rock Ln
- 3710 Meadowmist Ct
- 4110 Addison Ranch Ln
- 27410 Ashland Meadow Ln
- 27719 Merchant Hills Ln
- 3715 Cardiff Mist Dr
- 4218 Brannon Branch Ct
- 27414 Hollow Pass Ln
- 3526 Grayson Gardens Ct
- 3518 Grayson Gardens Ct
- 3514 Grayson Gardens Ct
- 3515 Grayson Gardens Ct
- 3511 Grayson Gardens Ct
- 3510 Grayson Gardens Ct
- 3507 Grayson Gardens Ct
- 3506 Grayson Gardens Ct
- 3503 Grayson Gardens Ct
- 27803 Harris Glen Ct
- 3502 Grayson Gardens Ct
- 27806 Harris Glen Ct
- 3419 Walker Falls Ln
- 27807 Harris Glen Ct
- 3423 Walker Falls Ln
- 27810 Harris Glen Ct
- 3402 Walker Falls Ln
- 3406 Walker Falls Ln
- 3503 Walker Falls Ln
- 3410 Walker Falls Ln