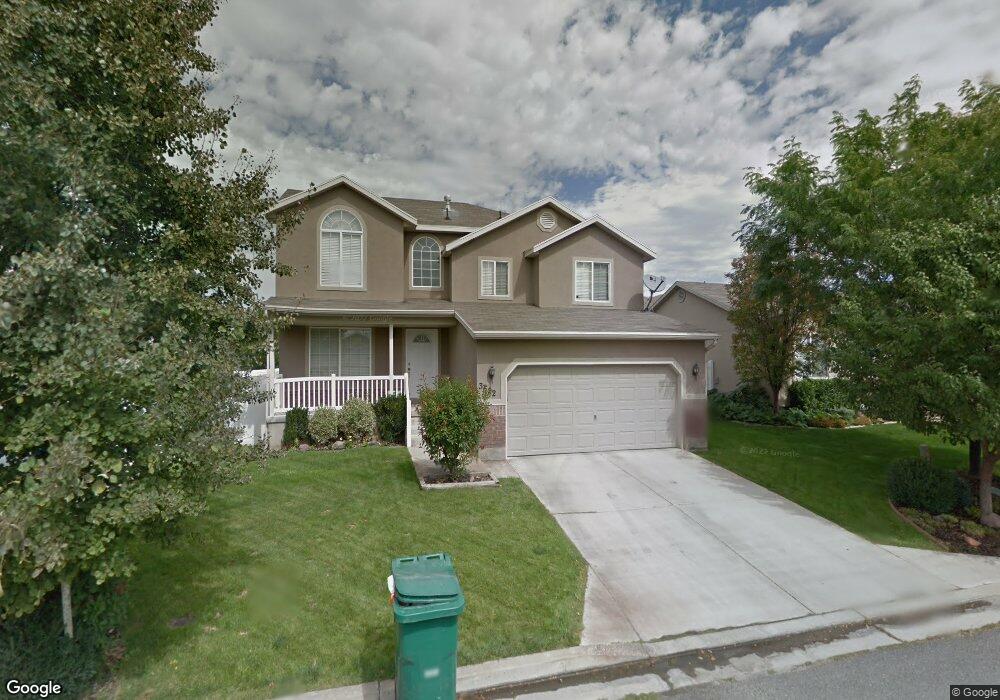
3522 Newland Loop Lehi, UT 84043
Thanksgiving NeighborhoodEstimated Value: $496,739 - $555,000
4
Beds
2
Baths
1,659
Sq Ft
$312/Sq Ft
Est. Value
About This Home
This home is located at 3522 Newland Loop, Lehi, UT 84043 and is currently estimated at $516,935, approximately $311 per square foot. 3522 Newland Loop is a home located in Utah County with nearby schools including Belmont Elementary, Skyridge High School, and Ignite Entrepreneurship Academy.
Ownership History
Date
Name
Owned For
Owner Type
Purchase Details
Closed on
Aug 14, 2017
Sold by
Springer Kelly
Bought by
Springer Kelly and Bowman Jeri A
Current Estimated Value
Home Financials for this Owner
Home Financials are based on the most recent Mortgage that was taken out on this home.
Original Mortgage
$191,500
Outstanding Balance
$159,792
Interest Rate
3.96%
Estimated Equity
$357,143
Purchase Details
Closed on
Jul 6, 2017
Sold by
Springer Ryan M and Springer Kelly A
Bought by
Springer Kelly
Home Financials for this Owner
Home Financials are based on the most recent Mortgage that was taken out on this home.
Original Mortgage
$191,500
Outstanding Balance
$159,792
Interest Rate
3.96%
Estimated Equity
$357,143
Purchase Details
Closed on
Jan 24, 2008
Sold by
Springer Ryan M
Bought by
Springer Ryan M and Springer Kelly A
Home Financials for this Owner
Home Financials are based on the most recent Mortgage that was taken out on this home.
Original Mortgage
$210,000
Interest Rate
6.09%
Purchase Details
Closed on
Jul 2, 2003
Sold by
Home Center Const & Development Llc
Bought by
Springer Ryan R
Create a Home Valuation Report for This Property
The Home Valuation Report is an in-depth analysis detailing your home's value as well as a comparison with similar homes in the area
Home Values in the Area
Average Home Value in this Area
Purchase History
| Date | Buyer | Sale Price | Title Company |
|---|---|---|---|
| Springer Kelly | -- | First American Title | |
| Springer Kelly | -- | None Available | |
| Springer Ryan M | -- | Surety Title | |
| Springer Ryan M | -- | Surety Title | |
| Springer Ryan R | -- | Merrill Title Company |
Source: Public Records
Mortgage History
| Date | Status | Borrower | Loan Amount |
|---|---|---|---|
| Open | Springer Kelly | $191,500 | |
| Previous Owner | Springer Ryan M | $210,000 |
Source: Public Records
Tax History Compared to Growth
Tax History
| Year | Tax Paid | Tax Assessment Tax Assessment Total Assessment is a certain percentage of the fair market value that is determined by local assessors to be the total taxable value of land and additions on the property. | Land | Improvement |
|---|---|---|---|---|
| 2025 | $2,054 | $242,825 | $191,200 | $250,300 |
| 2024 | $2,054 | $240,405 | $0 | $0 |
| 2023 | $1,949 | $247,610 | $0 | $0 |
| 2022 | $2,016 | $248,325 | $0 | $0 |
| 2021 | $1,795 | $334,300 | $110,600 | $223,700 |
| 2020 | $1,692 | $311,500 | $102,400 | $209,100 |
| 2019 | $1,602 | $306,500 | $102,400 | $204,100 |
| 2018 | $1,520 | $275,000 | $93,400 | $181,600 |
| 2017 | $1,379 | $132,660 | $0 | $0 |
| 2016 | $1,336 | $119,185 | $0 | $0 |
| 2015 | $1,341 | $113,630 | $0 | $0 |
| 2014 | $1,323 | $111,430 | $0 | $0 |
Source: Public Records
Map
Nearby Homes
- 4176 N Pilgrims Cir
- 4328 W Harvest Cove Unit 5
- 4063 New Land Loop
- 68-185 E Talisman Ave
- 4273 N Buckstone Way Unit 1373
- 4269 N Buckstone Way Unit 1372
- 4265 N Buckstone Way Unit 1371
- 4261 N Buckstone Way Unit 1370
- 4257 N Buckstone Way Unit 1369
- 4253 N Buckstone Way Unit 1368
- 3931 N Davencourt Loop
- 3162 W Desert Lily Dr
- 3147 W Davencourt Loop
- 3741 N Meadow Springs Ln
- 3477 N Bear Hollow Way
- 4420 N Buckstone Way Unit 1085
- 4426 N Buckstone Way Unit 1086
- 4432 N Buckstone Way Unit 1087
- 4438 N Buckstone Way Unit 1088
- DaVinci Traditional Plan at Holbrook Farms - Holbrook Place Estates
- 3522 W Newland Loop
- 3534 Newland Loop
- 3510 W Newland Loop
- 3534 W Newland Loop
- 3625 W Newland Loop
- 3546 Newland Loop
- 3546 W Newland Loop
- 3496 Newland Loop
- 3496 W Newland Loop
- 4180 N Pilgrims Cir
- 3517 W Newland Loop
- 3517 W Newland Loop
- 4161 Pilgrim Cir W
- 3510 Newland Loop
- 3510 Newland Loop
- 4161 Plymouth Rock Cove
- 3517 W Newland Loop
- 3529 W Newland Loop
- 3505 W Newland Loop
- 3505 W Newland Loop