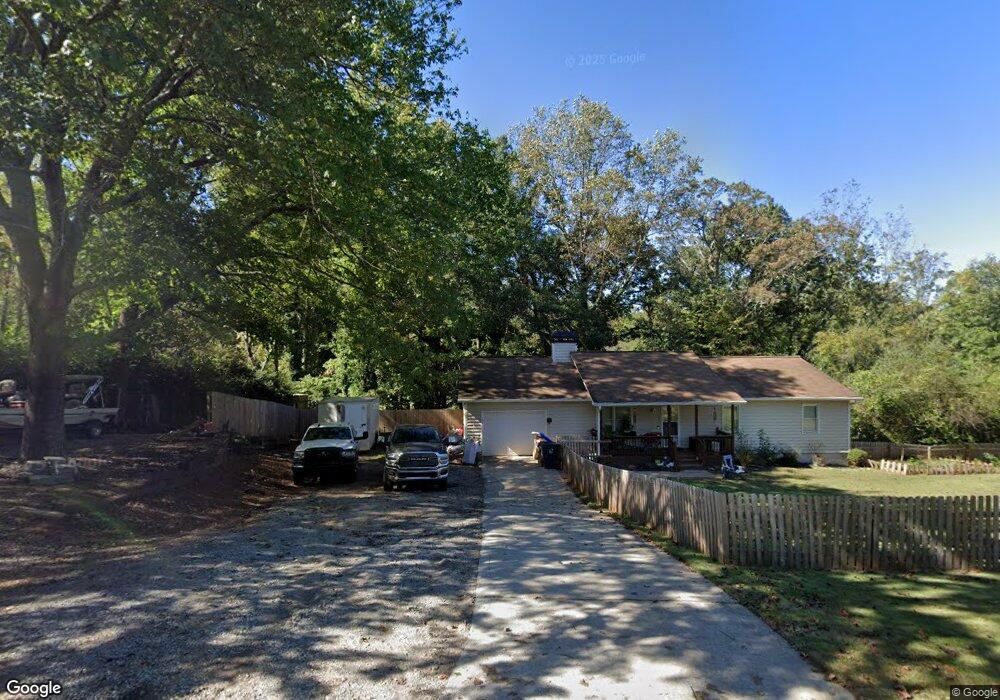
3523 Debbie Ct Unit 2 Duluth, GA 30097
Estimated Value: $381,000 - $448,000
3
Beds
2
Baths
1,392
Sq Ft
$295/Sq Ft
Est. Value
About This Home
This home is located at 3523 Debbie Ct Unit 2, Duluth, GA 30097 and is currently estimated at $410,839, approximately $295 per square foot. 3523 Debbie Ct Unit 2 is a home located in Gwinnett County with nearby schools including Parsons Elementary School, Hull Middle School, and Peachtree Ridge High School.
Ownership History
Date
Name
Owned For
Owner Type
Purchase Details
Closed on
Apr 8, 2020
Sold by
Veal Matthew Philmore
Bought by
Veal Matthew Philmore and Veal Mary Katherine
Current Estimated Value
Home Financials for this Owner
Home Financials are based on the most recent Mortgage that was taken out on this home.
Original Mortgage
$195,557
Outstanding Balance
$173,643
Interest Rate
3.75%
Mortgage Type
FHA
Estimated Equity
$237,196
Purchase Details
Closed on
Mar 22, 2019
Sold by
Hightower Ben Weldon
Bought by
Veal Matthew Philmore and Hightower Mary Katherine
Home Financials for this Owner
Home Financials are based on the most recent Mortgage that was taken out on this home.
Original Mortgage
$195,788
Interest Rate
4.5%
Mortgage Type
FHA
Purchase Details
Closed on
Jan 11, 2007
Sold by
Toel Donna T
Bought by
Hightower Ben W and Hightower Donna T
Purchase Details
Closed on
Oct 11, 1996
Sold by
Cupp Marvin K Kimberly
Bought by
Toel Donna T
Create a Home Valuation Report for This Property
The Home Valuation Report is an in-depth analysis detailing your home's value as well as a comparison with similar homes in the area
Home Values in the Area
Average Home Value in this Area
Purchase History
| Date | Buyer | Sale Price | Title Company |
|---|---|---|---|
| Veal Matthew Philmore | -- | -- | |
| Veal Matthew Philmore | $199,400 | -- | |
| Hightower Ben W | -- | -- | |
| Toel Donna T | $95,000 | -- |
Source: Public Records
Mortgage History
| Date | Status | Borrower | Loan Amount |
|---|---|---|---|
| Open | Veal Matthew Philmore | $195,557 | |
| Previous Owner | Veal Matthew Philmore | $195,788 | |
| Closed | Toel Donna T | $0 |
Source: Public Records
Tax History
| Year | Tax Paid | Tax Assessment Tax Assessment Total Assessment is a certain percentage of the fair market value that is determined by local assessors to be the total taxable value of land and additions on the property. | Land | Improvement |
|---|---|---|---|---|
| 2025 | $4,946 | $173,160 | $26,280 | $146,880 |
| 2024 | $3,596 | $100,640 | $20,000 | $80,640 |
| 2023 | $3,596 | $100,640 | $20,000 | $80,640 |
| 2022 | $3,556 | $100,640 | $20,000 | $80,640 |
| 2021 | $3,251 | $84,280 | $16,000 | $68,280 |
| 2020 | $3,269 | $84,280 | $16,000 | $68,280 |
| 2019 | $2,521 | $84,280 | $16,000 | $68,280 |
| 2018 | $2,246 | $71,600 | $13,600 | $58,000 |
| 2016 | $2,272 | $71,600 | $13,600 | $58,000 |
| 2015 | $1,973 | $58,920 | $11,200 | $47,720 |
| 2014 | $1,813 | $51,320 | $10,000 | $41,320 |
Source: Public Records
Map
Nearby Homes
- 3505 Stately Oaks Ln Unit 3
- 3670 Baxley Ridge Dr
- 3429 Parsons Ridge Ln
- 3614 Baxley Point Dr
- 3599 Baxley Point Dr
- 2008 Hailston Dr
- 2005 Hailston Dr
- 3565 Chelsea Falls Ln
- 3563 Chelsea Falls Ln
- 3561 Chelsea Falls Ln
- 3567 Chelsea Falls Ln
- 2017 Parsons Ridge Cir
- 1607 Baxley Pine Trace
- 2016 Parsons Ridge Cir
- 3310 Danielle Way
- 2011 Old Peachtree Rd NW
- 1667 Lake Louella Rd
- 3374 Floral Ct Unit 5
- 2107 Hailston Dr
- 1830 Briergate Dr
- 1742 Mitzi Ct
- 3513 Debbie Ct NW
- 3513 Debbie Ct Unit 2
- 3513 Debbie Ct
- 1752 Mitzi Ct
- 0 Debbie Ct Unit 7392407
- 0 Debbie Ct Unit 5388330
- 3524 Debbie Ct Unit 2
- 1731 Mitzi Ct
- 3503 Debbie Ct
- 3514 Debbie Ct
- 1741 Mitzi Ct Unit 2
- 1721 Mitzi Ct
- 3504 Debbie Ct
- 1762 Mitzi Ct
- 1751 Mitzi Ct
- 1711 Mitzi Ct Unit 2
- 1812 Mitzi Ct
- 1692 Mitzi Ct
- 3494 Debbie Ct
Your Personal Tour Guide
Ask me questions while you tour the home.