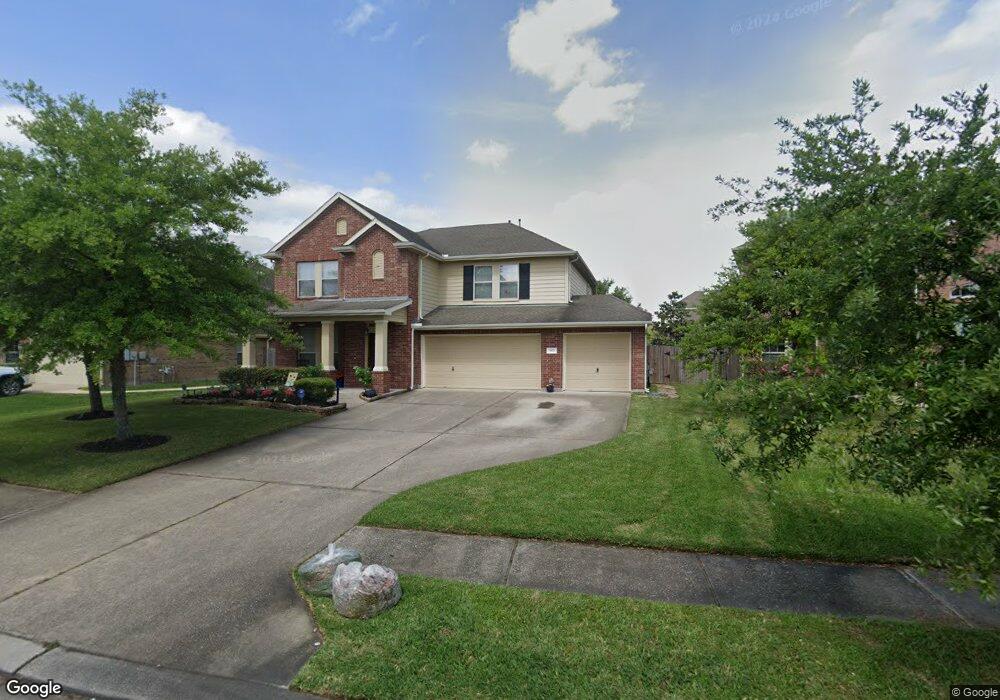
3523 Durango Canyon Ln Spring, TX 77386
Imperial Oaks NeighborhoodEstimated Value: $484,713 - $497,000
5
Beds
4
Baths
3,421
Sq Ft
$143/Sq Ft
Est. Value
About This Home
This home is located at 3523 Durango Canyon Ln, Spring, TX 77386 and is currently estimated at $490,678, approximately $143 per square foot. 3523 Durango Canyon Ln is a home located in Montgomery County with nearby schools including Birnham Woods Elementary School, York J High School, and Grand Oaks High School.
Ownership History
Date
Name
Owned For
Owner Type
Purchase Details
Closed on
Jun 29, 2017
Sold by
Joachim Donald and Lira Joachim Mary K
Bought by
Cannamore Christen and Cannamore Bryan
Current Estimated Value
Home Financials for this Owner
Home Financials are based on the most recent Mortgage that was taken out on this home.
Original Mortgage
$289,987
Outstanding Balance
$240,629
Interest Rate
4.02%
Mortgage Type
FHA
Estimated Equity
$250,049
Purchase Details
Closed on
Oct 25, 2013
Sold by
Burwick Charles N and Burwick Holly H
Bought by
Joachim Donald and Lira Joachim Mary K
Home Financials for this Owner
Home Financials are based on the most recent Mortgage that was taken out on this home.
Original Mortgage
$258,236
Interest Rate
4.62%
Mortgage Type
FHA
Purchase Details
Closed on
Jun 30, 2008
Sold by
Weekley Homes Lp
Bought by
Burwick Charles N and Burwick Holly H
Home Financials for this Owner
Home Financials are based on the most recent Mortgage that was taken out on this home.
Original Mortgage
$238,525
Interest Rate
5.99%
Mortgage Type
Purchase Money Mortgage
Create a Home Valuation Report for This Property
The Home Valuation Report is an in-depth analysis detailing your home's value as well as a comparison with similar homes in the area
Home Values in the Area
Average Home Value in this Area
Purchase History
| Date | Buyer | Sale Price | Title Company |
|---|---|---|---|
| Cannamore Christen | -- | Capital Title | |
| Joachim Donald | -- | Chicago Title | |
| Cannamore Bryan | -- | -- | |
| Burwick Charles N | -- | Priority Title Co |
Source: Public Records
Mortgage History
| Date | Status | Borrower | Loan Amount |
|---|---|---|---|
| Open | Cannamore Christen | $289,987 | |
| Previous Owner | Cannamore Bryan | $258,236 | |
| Previous Owner | Burwick Charles N | $238,525 |
Source: Public Records
Tax History Compared to Growth
Tax History
| Year | Tax Paid | Tax Assessment Tax Assessment Total Assessment is a certain percentage of the fair market value that is determined by local assessors to be the total taxable value of land and additions on the property. | Land | Improvement |
|---|---|---|---|---|
| 2025 | $9,917 | $478,420 | $68,000 | $410,420 |
| 2024 | $9,159 | $453,574 | -- | -- |
| 2023 | $9,159 | $412,340 | $68,000 | $394,510 |
| 2022 | $10,590 | $374,850 | $34,590 | $408,480 |
| 2021 | $10,457 | $340,770 | $34,590 | $306,180 |
| 2020 | $10,573 | $325,900 | $34,590 | $291,310 |
| 2019 | $10,941 | $328,120 | $34,590 | $293,530 |
| 2018 | $9,537 | $306,370 | $34,590 | $271,780 |
| 2017 | $10,322 | $307,070 | $34,590 | $272,480 |
| 2016 | $10,513 | $312,740 | $34,590 | $278,150 |
| 2015 | $8,936 | $297,560 | $34,590 | $278,150 |
| 2014 | $8,936 | $270,510 | $34,590 | $235,920 |
Source: Public Records
Map
Nearby Homes
- 3267 Old Ironwood Dr
- 31402 Linden Springs Ct
- 3611 Cape Vista Ct
- 31920 Scarlet Tupelo Way
- 31992 Retama Ranch Dr
- 31510 Orchard Hill Ln
- 31972 Retama Ranch Ln
- 31840 Pecan Cottage Ln
- 31992 Retama Ranch Ln
- 31418 Orchard Hill Ln
- 32015 Retama Ranch Ln
- 31996 Retama Ranch Ln
- 3619 Beacon Green Ln
- 31993 Retama Ranch Ln
- 31984 Retama Ranch Ln
- 31989 Retama Ranch Ln
- 32027 Retama Ranch Ln
- 31976 Retama Ranch Ln
- 31985 Retama Ranch Ln
- 3301 Asbury Glen Ct
- 3519 Durango Canyon Ln
- 3527 Durango Canyon Ln
- 3506 Avalon Spring Ln
- 3515 Durango Canyon Ln
- 3642 Sunlight Hill Ln
- 3446 Avalon Spring Ln
- 3518 Avalon Spring Ln
- 3511 Durango Canyon Ln
- 3638 Sunlight Hill Ln
- 31514 Morgan Hill Ct
- 3442 Avalon Spring Ln
- 3627 Sunlight Hill Ln
- 31510 Morgan Hill Ct
- 3522 Avalon Spring Ln
- 3634 Sunlight Hill Ln
- 3438 Avalon Spring Ln
- 3526 Avalon Spring Ln
- 31515 Morgan Hill Ct
- 3507 Durango Canyon Ln
- 3619 Sunlight Hill Ln