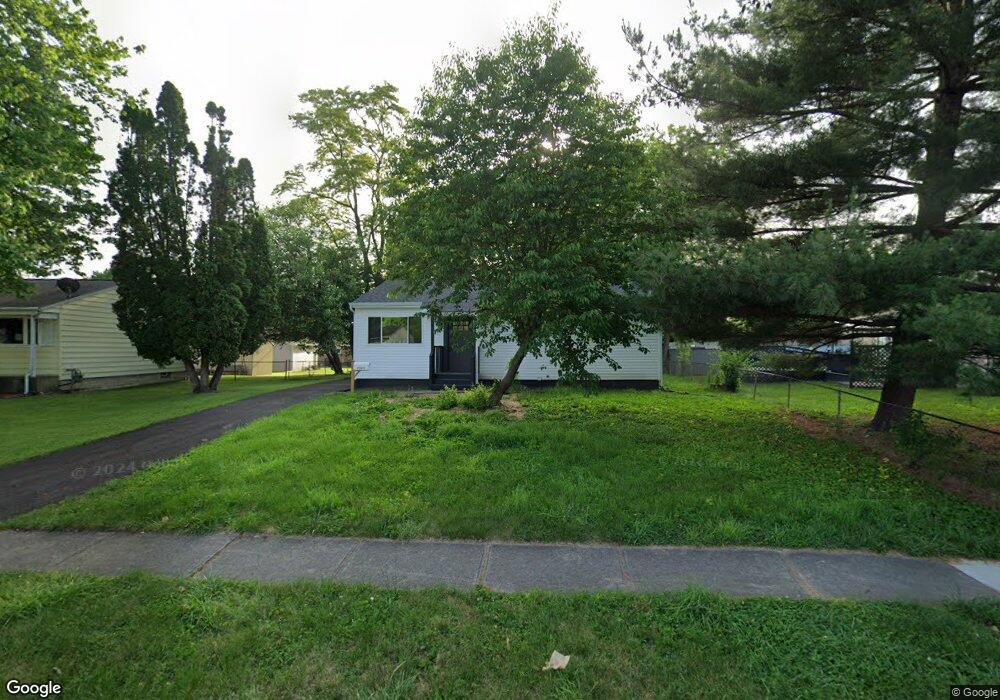
3523 Tremaine Rd Columbus, OH 43232
East Columbus-White Ash NeighborhoodEstimated Value: $179,285 - $193,000
3
Beds
1
Bath
936
Sq Ft
$199/Sq Ft
Est. Value
About This Home
This home is located at 3523 Tremaine Rd, Columbus, OH 43232 and is currently estimated at $186,321, approximately $199 per square foot. 3523 Tremaine Rd is a home located in Franklin County with nearby schools including Groveport Madison High School, Eastland Preparatory Academy, and A+ Arts Academy.
Ownership History
Date
Name
Owned For
Owner Type
Purchase Details
Closed on
Jul 12, 2023
Sold by
Pressley Management Group Inc
Bought by
Fisk Properties Llc
Current Estimated Value
Home Financials for this Owner
Home Financials are based on the most recent Mortgage that was taken out on this home.
Original Mortgage
$105,750
Interest Rate
6.67%
Mortgage Type
Credit Line Revolving
Purchase Details
Closed on
Jun 22, 2023
Sold by
Johnson Nadine J and Allen Joy L
Bought by
Pressley Management Group Inc
Home Financials for this Owner
Home Financials are based on the most recent Mortgage that was taken out on this home.
Original Mortgage
$105,750
Interest Rate
6.67%
Mortgage Type
Credit Line Revolving
Purchase Details
Closed on
Nov 5, 2021
Sold by
Franklin County Treasurer
Bought by
Johnson Nadine
Purchase Details
Closed on
Jul 21, 2009
Sold by
Johnson Nadine J
Bought by
Johnson Nadine J and Allen Joy L
Purchase Details
Closed on
Dec 20, 1972
Bought by
Johnson Nadine J
Create a Home Valuation Report for This Property
The Home Valuation Report is an in-depth analysis detailing your home's value as well as a comparison with similar homes in the area
Home Values in the Area
Average Home Value in this Area
Purchase History
| Date | Buyer | Sale Price | Title Company |
|---|---|---|---|
| Fisk Properties Llc | $65,000 | Axxis Title Agency | |
| Pressley Management Group Inc | $35,000 | None Listed On Document | |
| Johnson Nadine | -- | -- | |
| Johnson Nadine J | -- | Attorney | |
| Johnson Nadine J | -- | -- |
Source: Public Records
Mortgage History
| Date | Status | Borrower | Loan Amount |
|---|---|---|---|
| Closed | Fisk Properties Llc | $105,750 |
Source: Public Records
Tax History Compared to Growth
Tax History
| Year | Tax Paid | Tax Assessment Tax Assessment Total Assessment is a certain percentage of the fair market value that is determined by local assessors to be the total taxable value of land and additions on the property. | Land | Improvement |
|---|---|---|---|---|
| 2024 | $2,759 | $52,680 | $14,670 | $38,010 |
| 2023 | $3,117 | $52,120 | $14,670 | $37,450 |
| 2022 | $5,103 | $28,280 | $7,000 | $21,280 |
| 2021 | $4,398 | $28,280 | $7,000 | $21,280 |
| 2020 | $3,773 | $28,280 | $7,000 | $21,280 |
| 2019 | $2,953 | $23,880 | $5,850 | $18,030 |
| 2018 | $1,150 | $23,880 | $5,850 | $18,030 |
| 2017 | $1,108 | $23,880 | $5,850 | $18,030 |
| 2016 | $903 | $19,780 | $4,340 | $15,440 |
| 2015 | $895 | $19,780 | $4,340 | $15,440 |
| 2014 | $798 | $19,780 | $4,340 | $15,440 |
| 2013 | $428 | $21,980 | $4,830 | $17,150 |
Source: Public Records
Map
Nearby Homes
- 3493 Tremaine Rd
- 3496 Cadell Rd
- 3567 Wymore Place
- 5106 Harbor Blvd
- 5044 Albany Dr
- 5254 Sedalia Dr
- 3739 Atkinson Rd
- 3721 Aurelia Dr
- 5004 Bentler Dr
- 5152 Burdett Dr
- 3773 Clearwater Dr
- 5391 Newport Rd
- 3773 Tylor Dr
- 3246 Latonia Rd
- 5218 Fullerton Dr
- 5174 Fullerton Dr
- 5522 Newport Ct
- 4783 Nieles Edge Dr
- 5096 Fullerton Dr
- 4784 Nieles Edge Dr
- 3529 Tremaine Rd
- 3516 Wymore Place
- 3541 Tremaine Rd
- 3508 Wymore Place
- 3524 Wymore Place
- 5067 Wymore Dr
- 3536 Wymore Place
- 3524 Tremaine Rd
- 3512 Tremaine Rd
- 3532 Tremaine Rd
- 3549 Tremaine Rd
- 5080 Wymore Dr
- 3544 Wymore Place
- 3506 Tremaine Rd
- 3544 Tremaine Rd
- 5072 Wymore Dr
- 3552 Wymore Place
- 3500 Tremaine Rd
- 3555 Tremaine Rd
- 5064 Wymore Dr