Estimated Value: $372,000 - $469,000
3
Beds
3
Baths
4,228
Sq Ft
$98/Sq Ft
Est. Value
About This Home
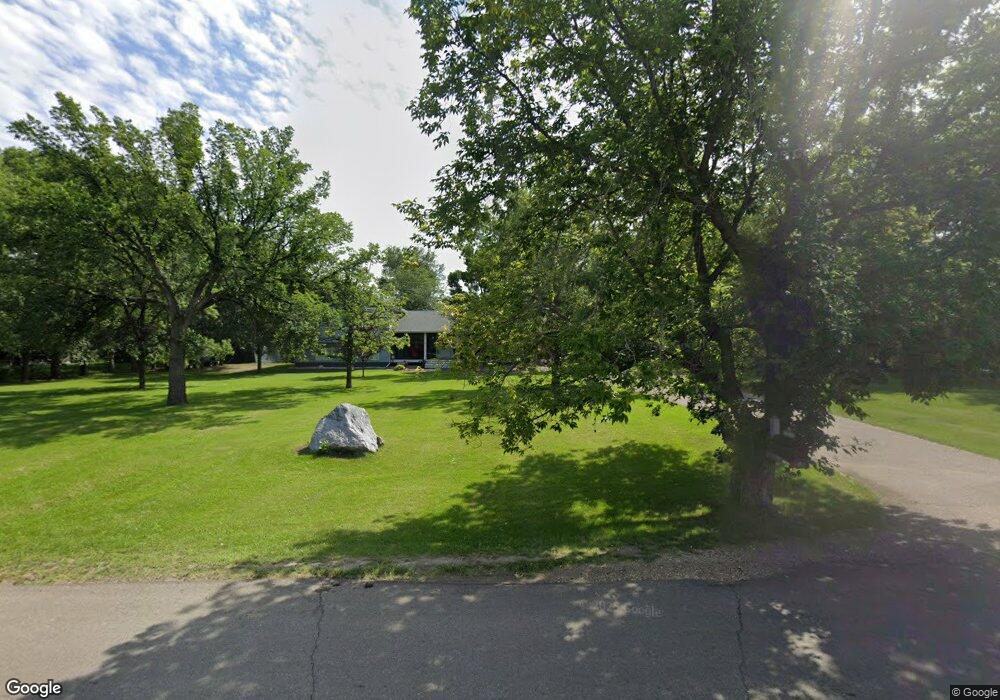
This home is located at 3525 5th Ave SW, Minot, ND 58701 and is currently estimated at $413,596, approximately $97 per square foot. 3525 5th Ave SW is a home located in Ward County with nearby schools including Perkett Elementary School, Jim Hill Middle School, and Magic City Campus High School.
Ownership History
Date
Name
Owned For
Owner Type
Purchase Details
Closed on
Aug 30, 2010
Sold by
Greenwell Leann M and Warren Greenwell J
Bought by
Jackson Bryan W and Jackson Krystal M
Current Estimated Value
Home Financials for this Owner
Home Financials are based on the most recent Mortgage that was taken out on this home.
Original Mortgage
$177,608
Outstanding Balance
$116,000
Interest Rate
4.38%
Mortgage Type
FHA
Estimated Equity
$297,596
Purchase Details
Closed on
May 12, 2010
Sold by
Greenwell Leann M and Greenwell Joseph W
Bought by
Greenwell Leann M and Dahly Rick
Purchase Details
Closed on
May 4, 2010
Sold by
Dahly Wilfred L
Bought by
Greenwell Leann M
Purchase Details
Closed on
Apr 13, 2009
Sold by
Dahty Geraldine M
Bought by
Dahly Wilfred L
Create a Home Valuation Report for This Property
The Home Valuation Report is an in-depth analysis detailing your home's value as well as a comparison with similar homes in the area
Home Values in the Area
Average Home Value in this Area
Purchase History
| Date | Buyer | Sale Price | Title Company |
|---|---|---|---|
| Jackson Bryan W | -- | -- | |
| Jackson Bryan | -- | -- | |
| Greenwell Leann M | -- | -- | |
| Greenwell Leann M | -- | -- | |
| Dahly Wilfred L | -- | None Available |
Source: Public Records
Mortgage History
| Date | Status | Borrower | Loan Amount |
|---|---|---|---|
| Open | Jackson Bryan W | $177,608 |
Source: Public Records
Tax History Compared to Growth
Tax History
| Year | Tax Paid | Tax Assessment Tax Assessment Total Assessment is a certain percentage of the fair market value that is determined by local assessors to be the total taxable value of land and additions on the property. | Land | Improvement |
|---|---|---|---|---|
| 2024 | $3,698 | $177,000 | $26,000 | $151,000 |
| 2023 | $3,713 | $178,500 | $26,000 | $152,500 |
| 2022 | $3,567 | $178,500 | $24,500 | $154,000 |
| 2021 | $3,046 | $167,000 | $24,500 | $142,500 |
| 2020 | $2,910 | $160,000 | $24,500 | $135,500 |
| 2019 | $2,907 | $157,500 | $24,500 | $133,000 |
| 2018 | $3,162 | $159,500 | $24,500 | $135,000 |
| 2017 | $3,072 | $162,500 | $27,500 | $135,000 |
| 2016 | $1,750 | $104,500 | $10,700 | $93,800 |
| 2015 | $1,679 | $104,500 | $0 | $0 |
| 2014 | $1,679 | $102,500 | $0 | $0 |
Source: Public Records
Map
Nearby Homes
- 145 26th St SW
- 2510 2nd Ave SW
- 117 26th St SW
- 2416 2nd Ave SW Unit Minot
- 108 24th St SW
- 18 24th St SW
- 416 22nd St SW
- 100 21st St NW
- 1709 5th Ave SW
- 916 26th St NW
- 2201 7th Ave NW
- 514 16th St SW
- 221 17th St NW
- 516 Forest Rd
- 2544 10th Ave NW
- 516 19th St NW
- 0 Hwy 2 & 52 W & County Rd 17 Unit LOT 1 BLOCK 1 230988
- 0 Hwy 2 & 52 W & County Rd 17 Unit LOT 2 BLOCK 2 230986
- 0 Hwy 2 & 52 W & County Rd 17 Unit LOT 1 BLOCK 2 230987
- 0 Hwy 2 & 52 W & County Rd 17 Unit LOT 4 BLOCK 2 230984
- 3521 5th Ave SW
- 3535 5th Ave SW
- 3515 5th Ave SW
- 3515 5th Ave SW Unit Tierrecita Vallejo
- 0 5th Ave Unit tbd 192083
- 3545 5th Ave SW
- 3501 5th Ave SW
- 511 36th St SW
- 521 36th St SW
- 601 36th St SW
- 500 36th St SW
- 510 36th St SW
- 510 36th St SW Unit Tierracita Vallejo
- 611 36th St SW
- 711 36th St SW
- 520 36th St SW
- 600 36th St SW
- 600 36th St SW Unit Tierrecita Vallejo
- 801 36th St SW
- 3611 5th Ave SW