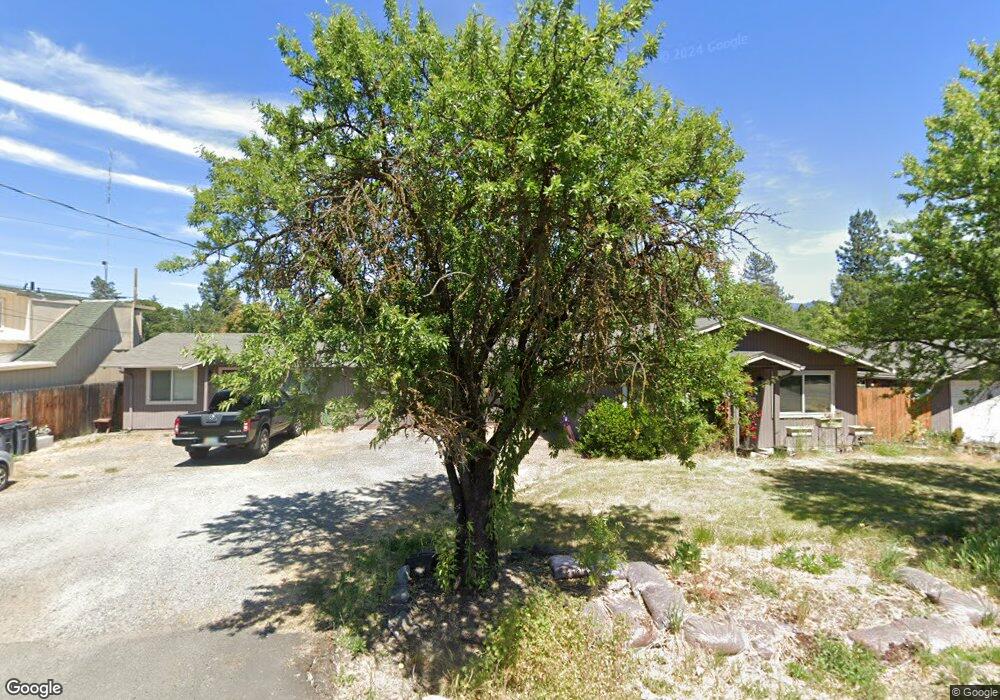
3525 Colver Rd Phoenix, OR 97535
Estimated Value: $390,000 - $1,712,000
5
Beds
3
Baths
2,080
Sq Ft
$421/Sq Ft
Est. Value
About This Home
This home is located at 3525 Colver Rd, Phoenix, OR 97535 and is currently estimated at $875,333, approximately $420 per square foot. 3525 Colver Rd is a home located in Jackson County with nearby schools including Phoenix Elementary School, Talent Middle School, and Phoenix High School.
Ownership History
Date
Name
Owned For
Owner Type
Purchase Details
Closed on
Feb 3, 2021
Sold by
Sharpe Kenneth E
Bought by
Sharpe Kenneth E and The Sharpe Family Trust
Current Estimated Value
Purchase Details
Closed on
Oct 18, 2006
Sold by
Sharpe Ken E and Sharpe Johnna M
Bought by
Sharpe Kenneth E and Sharpe Johnna M
Home Financials for this Owner
Home Financials are based on the most recent Mortgage that was taken out on this home.
Original Mortgage
$67,500
Interest Rate
6.46%
Mortgage Type
Credit Line Revolving
Create a Home Valuation Report for This Property
The Home Valuation Report is an in-depth analysis detailing your home's value as well as a comparison with similar homes in the area
Home Values in the Area
Average Home Value in this Area
Purchase History
| Date | Buyer | Sale Price | Title Company |
|---|---|---|---|
| Sharpe Kenneth E | -- | None Available | |
| Sharpe Kenneth E | -- | Lawyers Title Ins |
Source: Public Records
Mortgage History
| Date | Status | Borrower | Loan Amount |
|---|---|---|---|
| Previous Owner | Sharpe Kenneth E | $67,500 |
Source: Public Records
Tax History
| Year | Tax Paid | Tax Assessment Tax Assessment Total Assessment is a certain percentage of the fair market value that is determined by local assessors to be the total taxable value of land and additions on the property. | Land | Improvement |
|---|---|---|---|---|
| 2026 | $3,479 | $218,170 | -- | -- |
| 2025 | $3,397 | $211,820 | $77,160 | $134,660 |
| 2024 | $3,397 | $205,660 | $74,910 | $130,750 |
| 2023 | $3,290 | $199,670 | $72,730 | $126,940 |
| 2022 | $3,203 | $199,670 | $72,730 | $126,940 |
| 2021 | $3,126 | $193,860 | $70,610 | $123,250 |
| 2020 | $3,028 | $188,220 | $68,560 | $119,660 |
| 2019 | $2,947 | $177,420 | $64,640 | $112,780 |
| 2018 | $2,861 | $172,260 | $62,760 | $109,500 |
| 2017 | $2,703 | $172,260 | $62,760 | $109,500 |
| 2016 | $2,630 | $162,380 | $59,150 | $103,230 |
| 2015 | $2,528 | $162,380 | $40,530 | $121,850 |
| 2014 | $2,432 | $153,070 | $38,200 | $114,870 |
Source: Public Records
Map
Nearby Homes
- 130 Rhonda Ln
- 113 Houston Rd
- 316 W 3rd St
- 130 Sharon Dr
- 215 S C St
- 146 Sharon Dr
- 510 N Main St
- 921 N Rose St Unit A
- 600 N Main St
- 610 N Main St Unit 5A
- 612 N Main St
- 113 Skyler Ln
- 3459 S Pacific Hwy
- 3985 Calhoun Rd
- 300 Luman Rd Unit 197
- 300 Luman Rd Unit 200
- 817 Amerman Dr
- 4074 S Pacific Hwy Unit 10
- 513 Barnum Dr
- 3966 S Pacific Hwy Unit 81
Your Personal Tour Guide
Ask me questions while you tour the home.