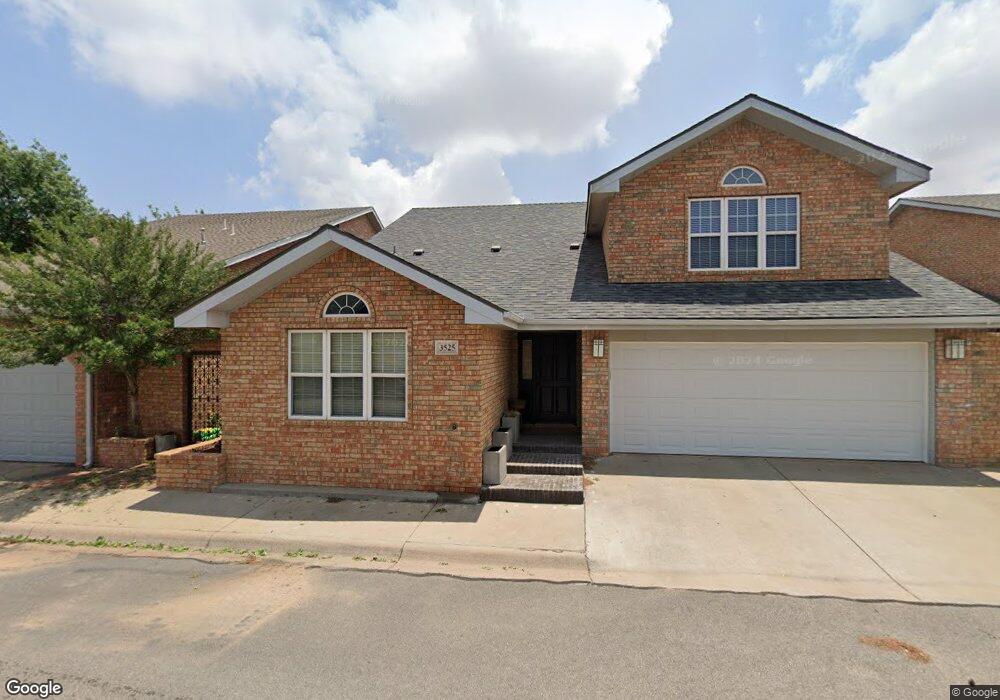
3525 Lonoke Ave Midland, TX 79707
Estimated Value: $432,564 - $483,000
--
Bed
--
Bath
2,746
Sq Ft
$165/Sq Ft
Est. Value
About This Home
This home is located at 3525 Lonoke Ave, Midland, TX 79707 and is currently estimated at $453,891, approximately $165 per square foot. 3525 Lonoke Ave is a home located in Midland County with nearby schools including Rusk Elementary School, Alamo Junior High School, and Midland Montessori School.
Ownership History
Date
Name
Owned For
Owner Type
Purchase Details
Closed on
Mar 1, 2017
Sold by
Harrison Shirley R
Bought by
Gee Bradly R and Saxon Stacy M
Current Estimated Value
Home Financials for this Owner
Home Financials are based on the most recent Mortgage that was taken out on this home.
Original Mortgage
$244,350
Outstanding Balance
$201,686
Interest Rate
4.09%
Mortgage Type
New Conventional
Estimated Equity
$252,205
Purchase Details
Closed on
Aug 17, 2005
Sold by
Morse Michael B and Morse Eleoanor F
Bought by
Harrison Shirley R
Home Financials for this Owner
Home Financials are based on the most recent Mortgage that was taken out on this home.
Original Mortgage
$127,200
Interest Rate
5.65%
Mortgage Type
New Conventional
Purchase Details
Closed on
Nov 21, 2000
Sold by
Morse Properties Llc
Bought by
Gee Bradley R
Purchase Details
Closed on
Nov 15, 1999
Sold by
Morse Michael B
Bought by
Gee Bradley R
Purchase Details
Closed on
May 19, 1997
Bought by
Gee Bradley R
Purchase Details
Closed on
May 1, 1997
Bought by
Gee Bradley R
Purchase Details
Closed on
Sep 27, 1994
Bought by
Gee Bradley R
Create a Home Valuation Report for This Property
The Home Valuation Report is an in-depth analysis detailing your home's value as well as a comparison with similar homes in the area
Home Values in the Area
Average Home Value in this Area
Purchase History
| Date | Buyer | Sale Price | Title Company |
|---|---|---|---|
| Gee Bradly R | -- | Stewart Title Company | |
| Harrison Shirley R | -- | None Available | |
| Gee Bradley R | -- | -- | |
| Gee Bradley R | -- | -- | |
| Gee Bradley R | -- | -- | |
| Gee Bradley R | -- | -- | |
| Gee Bradley R | -- | -- |
Source: Public Records
Mortgage History
| Date | Status | Borrower | Loan Amount |
|---|---|---|---|
| Open | Gee Bradly R | $244,350 | |
| Previous Owner | Harrison Shirley R | $127,200 |
Source: Public Records
Tax History Compared to Growth
Tax History
| Year | Tax Paid | Tax Assessment Tax Assessment Total Assessment is a certain percentage of the fair market value that is determined by local assessors to be the total taxable value of land and additions on the property. | Land | Improvement |
|---|---|---|---|---|
| 2025 | $5,920 | $471,310 | $18,020 | $453,290 |
| 2024 | $5,930 | $477,050 | $18,020 | $459,030 |
| 2023 | $5,457 | $450,050 | $18,020 | $432,030 |
| 2022 | $6,718 | $429,950 | $18,020 | $411,930 |
| 2021 | $7,490 | $429,950 | $18,020 | $411,930 |
| 2020 | $6,065 | $413,190 | $18,020 | $395,170 |
| 2019 | $6,801 | $359,250 | $18,020 | $395,170 |
| 2018 | $6,350 | $326,590 | $18,020 | $308,570 |
| 2017 | $6,418 | $330,100 | $18,020 | $312,080 |
| 2016 | $6,169 | $316,690 | $18,020 | $298,670 |
| 2015 | -- | $316,690 | $18,020 | $298,670 |
| 2014 | -- | $317,960 | $0 | $0 |
Source: Public Records
Map
Nearby Homes
- 3523 Lonoke Ave
- 1502 Alcove Ct
- 1509 Cascade Ct
- 1103 Tarleton St
- 3517 Seaboard Ave
- 2000 Freeport Ln
- 2106 Rosita Dr
- 3214 Lockheed Dr
- 3204 Shell Ave
- 3213 Sentinel Dr
- 3213 Shell Ave
- 3209 Sinclair Ave
- 1818 Northern Ln
- 3206 W Golf Course Rd
- 1824 Northern Ln
- 3204 W Golf Course Rd
- 3205 Boyd Ave
- 2607 Bedford Ave
- 2121 Bonham St
- 3311 Terrace Ave
- 3527 Lonoke Ave
- 3529 Lonoke Ave
- 3521 Lonoke Ave
- 3531 Lonoke Ave
- 3526 Lonoke Ave
- 3528 Lonoke Ave
- 3524 Lonoke Ave
- 3530 Lonoke Ave
- 3532 Lonoke Ave
- 3533 Lonoke Ave
- 3534 Lonoke Ave
- 3536 Lonoke Ave
- 3527 Boyd Ave
- 3529 Boyd Ave
- 3525 Boyd Ave
- 3531 Boyd Ave
- 3533 Boyd Ave
- 3535 Boyd Ave
- 3537 Boyd Ave
- 3521 Boyd Ave