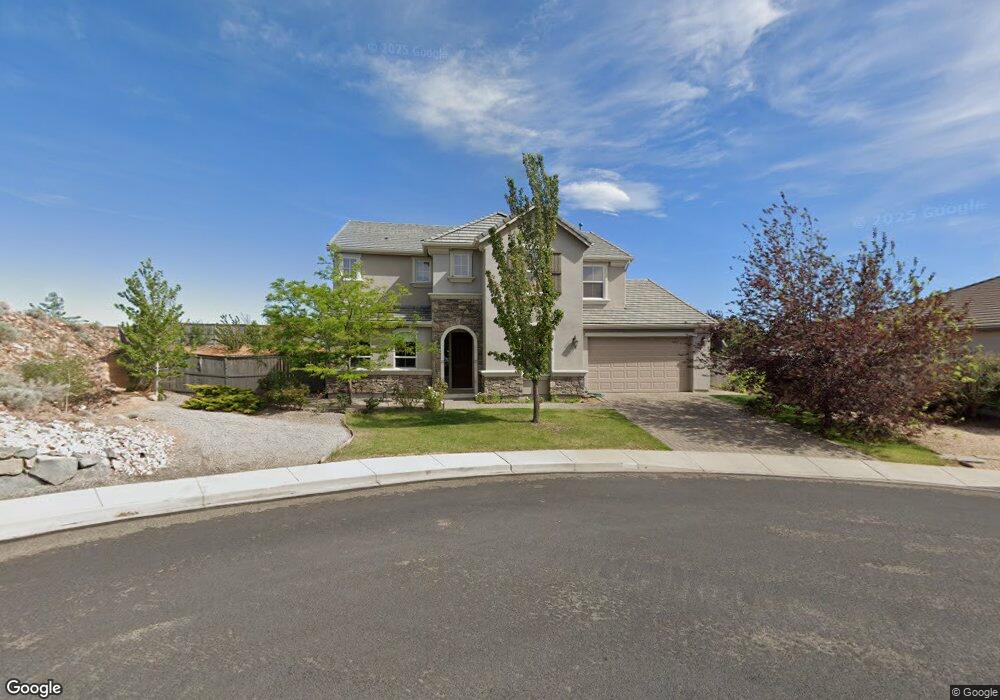
3525 Rock Ridge Ct Unit 9 Reno, NV 89512
West University NeighborhoodEstimated Value: $753,122 - $1,021,000
5
Beds
3
Baths
3,160
Sq Ft
$283/Sq Ft
Est. Value
About This Home
This home is located at 3525 Rock Ridge Ct Unit 9, Reno, NV 89512 and is currently estimated at $894,781, approximately $283 per square foot. 3525 Rock Ridge Ct Unit 9 is a home located in Washoe County with nearby schools including Peavine Elementary School, Archie Clayton Pre-AP Academy, and Coral Academy Charter School Elementary.
Ownership History
Date
Name
Owned For
Owner Type
Purchase Details
Closed on
Jan 10, 2011
Sold by
Shaik Miskat
Bought by
Apalategui Olatz and Walker Guy L
Current Estimated Value
Home Financials for this Owner
Home Financials are based on the most recent Mortgage that was taken out on this home.
Original Mortgage
$176,750
Outstanding Balance
$1,260
Interest Rate
3.5%
Mortgage Type
FHA
Estimated Equity
$893,521
Purchase Details
Closed on
May 25, 2006
Sold by
Khatun Anzira
Bought by
Shaik Miskat
Home Financials for this Owner
Home Financials are based on the most recent Mortgage that was taken out on this home.
Original Mortgage
$517,662
Interest Rate
3.25%
Mortgage Type
Negative Amortization
Create a Home Valuation Report for This Property
The Home Valuation Report is an in-depth analysis detailing your home's value as well as a comparison with similar homes in the area
Home Values in the Area
Average Home Value in this Area
Purchase History
| Date | Buyer | Sale Price | Title Company |
|---|---|---|---|
| Apalategui Olatz | $285,000 | First Centennial Reno | |
| Shaik Miskat | -- | North American Title Co | |
| Shaik Miskat | $575,500 | North American Title Co |
Source: Public Records
Mortgage History
| Date | Status | Borrower | Loan Amount |
|---|---|---|---|
| Open | Apalategui Olatz | $176,750 | |
| Previous Owner | Shaik Miskat | $517,662 |
Source: Public Records
Tax History Compared to Growth
Tax History
| Year | Tax Paid | Tax Assessment Tax Assessment Total Assessment is a certain percentage of the fair market value that is determined by local assessors to be the total taxable value of land and additions on the property. | Land | Improvement |
|---|---|---|---|---|
| 2026 | -- | $183,816 | $46,515 | $137,302 |
| 2025 | $1,959 | $185,963 | $46,515 | $139,448 |
| 2024 | $1,959 | $182,494 | $42,525 | $139,969 |
| 2023 | $3,810 | $176,955 | $44,520 | $132,435 |
| 2022 | $3,698 | $151,020 | $40,845 | $110,175 |
| 2021 | $3,597 | $138,271 | $28,980 | $109,291 |
| 2020 | $3,487 | $140,964 | $31,675 | $109,289 |
| 2019 | $3,384 | $136,234 | $30,625 | $105,609 |
| 2018 | $3,285 | $126,132 | $23,450 | $102,682 |
| 2017 | $3,190 | $124,134 | $21,525 | $102,609 |
| 2016 | $3,109 | $124,982 | $20,125 | $104,857 |
| 2015 | $2,329 | $117,304 | $18,305 | $98,999 |
| 2014 | $3,013 | $100,154 | $15,330 | $84,824 |
| 2013 | -- | $79,606 | $11,410 | $68,196 |
Source: Public Records
Map
Nearby Homes
- 1080 S University Park Loop
- 1120 University Park Ct
- 3510 Comstock Dr
- 3715 Coastal St
- 3621 Pimlico St
- 3656 Ruidoso St
- 3566 Penn National Dr
- 27 Chianti Way
- 29 Chianti Way
- 18 Colombard Way
- 26 S Chardonnay St
- 93 Cabernet Pkwy
- 45 Chablis Dr
- 970 Demos Ct
- 44 Chablis Dr
- 2135 Barberry Way
- 23 Chablis Dr
- 2140 Barberry Way
- 1176 Arrastra Rd Unit Lot 16
- 1172 Arrastra Rd
- 3535 Rock Ridge Ct
- 3424 Weaver Place
- 3416 Weaver Place
- 3432 Weaver Place
- 3545 Rock Ridge Ct
- 3440 Weaver Place
- 3408 Weaver Place
- 3560 Rock Ridge Ct
- 1035 S University Park Loop
- 1025 S University Park Loop
- 3570 Rock Ridge Ct
- 1045 S University Park Loop
- 3407 Weaver Place
- 3555 Rock Ridge Ct
- 3411 Weaver Place
- 3448 Weaver Place
- 3580 Rock Ridge Ct
- 2472 Weaver Place
- 3400 Weaver Place
- 1030 S University Park Loop