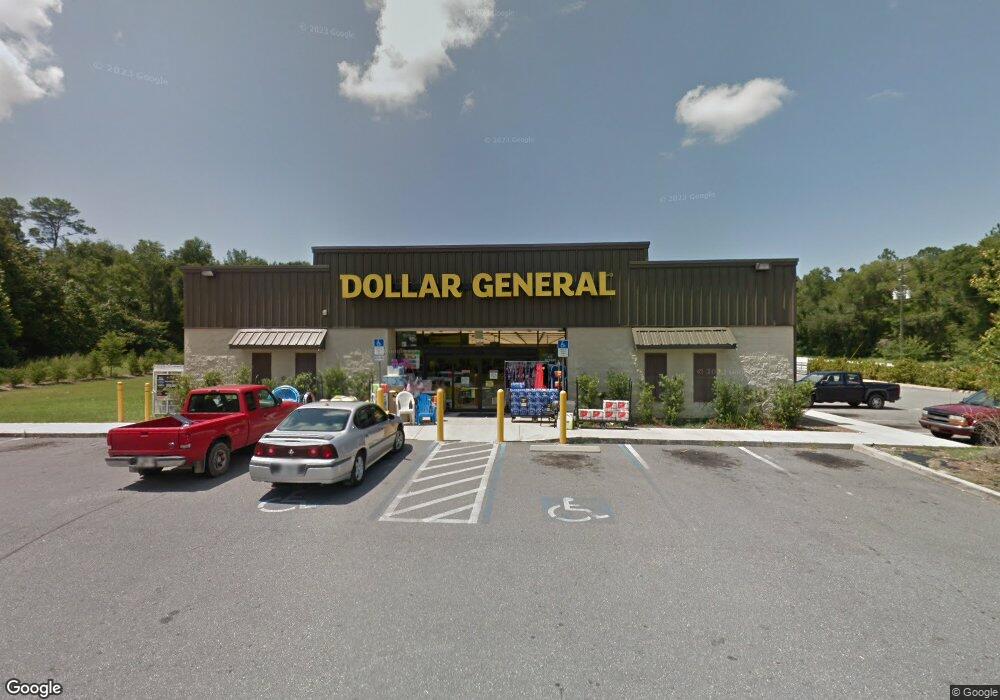
3525 W Gulf To Lake Hwy Lecanto, FL 34461
Lecanto NeighborhoodEstimated Value: $2,503,545
--
Bed
2
Baths
9,167
Sq Ft
$273/Sq Ft
Est. Value
About This Home
This home is located at 3525 W Gulf To Lake Hwy, Lecanto, FL 34461 and is currently estimated at $2,503,545, approximately $273 per square foot. 3525 W Gulf To Lake Hwy is a home located in Citrus County with nearby schools including Lecanto Primary School, Lecanto Middle School, and Lecanto High School.
Ownership History
Date
Name
Owned For
Owner Type
Purchase Details
Closed on
Mar 2, 2020
Sold by
Canto Realty Llc
Bought by
Dwight E Wagner Family Lp
Current Estimated Value
Purchase Details
Closed on
Sep 25, 2013
Sold by
Lukenmax Llc
Bought by
Canto Realty Llc
Purchase Details
Closed on
Jun 5, 2012
Sold by
Lukenmax Llc
Bought by
County Of Citrus
Purchase Details
Closed on
Dec 28, 2011
Sold by
Teramore Development Llc
Bought by
Lukenmax Llc
Home Financials for this Owner
Home Financials are based on the most recent Mortgage that was taken out on this home.
Original Mortgage
$913,500
Interest Rate
4.06%
Mortgage Type
Commercial
Purchase Details
Closed on
Jan 18, 2011
Sold by
Ward Margaret C and Harold & Margaret Ward Trust
Bought by
Teramore Development Llc
Purchase Details
Closed on
May 1, 2007
Sold by
Ward Harold M
Bought by
Ward Harold M and Ward Margaret C
Create a Home Valuation Report for This Property
The Home Valuation Report is an in-depth analysis detailing your home's value as well as a comparison with similar homes in the area
Home Values in the Area
Average Home Value in this Area
Purchase History
| Date | Buyer | Sale Price | Title Company |
|---|---|---|---|
| Dwight E Wagner Family Lp | $1,570,000 | Attorney | |
| Canto Realty Llc | $1,500,000 | Attorney | |
| County Of Citrus | -- | Attorney | |
| Lukenmax Llc | $1,290,300 | Attorney | |
| Teramore Development Llc | $250,000 | None Available | |
| Ward Harold M | -- | Attorney |
Source: Public Records
Mortgage History
| Date | Status | Borrower | Loan Amount |
|---|---|---|---|
| Previous Owner | Lukenmax Llc | $913,500 |
Source: Public Records
Tax History Compared to Growth
Tax History
| Year | Tax Paid | Tax Assessment Tax Assessment Total Assessment is a certain percentage of the fair market value that is determined by local assessors to be the total taxable value of land and additions on the property. | Land | Improvement |
|---|---|---|---|---|
| 2024 | $17,080 | $1,100,700 | $372,880 | $727,820 |
| 2023 | $17,080 | $1,062,210 | $372,880 | $689,330 |
| 2022 | $16,497 | $1,062,210 | $372,880 | $689,330 |
| 2021 | $15,799 | $1,025,310 | $362,340 | $662,970 |
| 2020 | $15,547 | $1,025,310 | $362,340 | $662,970 |
| 2019 | $15,761 | $1,025,310 | $335,990 | $689,320 |
| 2018 | $17,154 | $1,106,810 | $335,990 | $770,820 |
| 2017 | $16,889 | $1,065,120 | $335,990 | $729,130 |
| 2016 | $16,986 | $1,030,580 | $335,990 | $694,590 |
| 2015 | $17,416 | $1,030,580 | $335,990 | $694,590 |
| 2014 | $17,964 | $1,027,817 | $442,954 | $584,863 |
Source: Public Records
Map
Nearby Homes
- 3132 W Gulf To Lake Hwy
- 1054 S Brookfield Dr
- 3049 W Laurel St
- 1189 S Fieldview Loop
- 1148 S Softwind Loop
- 3943 W Fieldwood Ct
- 950 S Yellowwood Terrace
- 1322 S Brookfield Dr
- 1342 S Brookfield Dr
- 4164 W Gulf To Lake Hwy
- 2630 W Gulf To Lake Hwy
- 2659-2621 W Gulf To Lake Hwy
- 4610 W Southern St
- 4540 W Sandy Hill St
- 620 S Fairlane Terrace
- 4176 W Gulf To Lake Hwy
- 89 S Scarboro Ave
- 5042 W Southern St
- 285 S Spice Wood Terrace
- 290 S Spice Wood Terrace
- 3591 W Gulf To Lake Hwy
- 3440 W Gulf To Lake Hwy
- 600 S Country Oaks Terrace
- 3618 W Southern St
- 3840 W Homosassa Trail
- 3400 W Southern St
- 3764 W Gulf To Lake Hwy
- 3782 W Gulf To Lake Hwy
- 3805 W Homosassa Trail
- 862 S Lecanto Hwy
- 3535 W Southern St
- 835 S Lecanto Hwy
- 3214 W Postal Ln
- 3795 W Northcrest Ct
- 3779 W Northcrest Ct
- 3325 W Southern St
- 3869 W Homosassa Trail
- 3217 W Gulf To Lake Hwy
- 3819 W Northcrest Ct
- 3228 W Laurel St