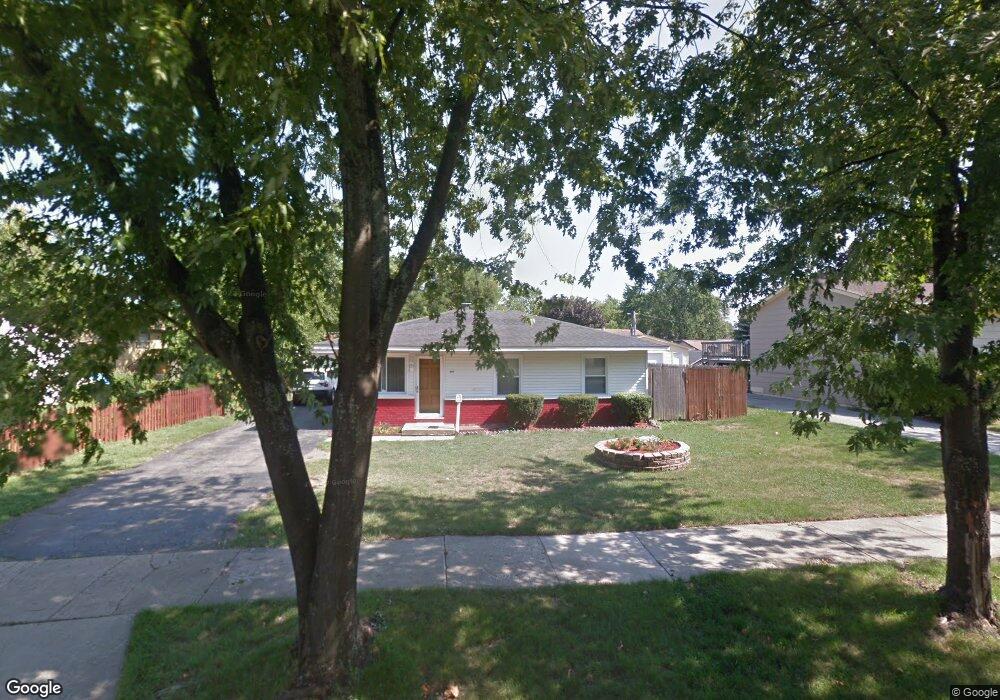
3525 Winhaven Dr Waukegan, IL 60087
Estimated Value: $225,000 - $283,000
3
Beds
2
Baths
1,008
Sq Ft
$249/Sq Ft
Est. Value
About This Home
This home is located at 3525 Winhaven Dr, Waukegan, IL 60087 and is currently estimated at $251,137, approximately $249 per square foot. 3525 Winhaven Dr is a home located in Lake County with nearby schools including H R McCall Elementary School, Jack Benny Middle School, and Waukegan High School.
Ownership History
Date
Name
Owned For
Owner Type
Purchase Details
Closed on
Dec 12, 2016
Sold by
Galaxy Sites Llc
Bought by
Witt Holdings Llc
Current Estimated Value
Purchase Details
Closed on
Nov 14, 2016
Sold by
County Of Lake
Bought by
Galaxy Sites Llc
Purchase Details
Closed on
Jun 2, 2016
Sold by
Luna Jose L and Luna Melania
Bought by
Luna Rosalba
Purchase Details
Closed on
Nov 27, 2000
Sold by
Oglesby Tim I and Oglesby Renee D
Bought by
Luna Rosalba and Luna Jose L
Home Financials for this Owner
Home Financials are based on the most recent Mortgage that was taken out on this home.
Original Mortgage
$107,822
Interest Rate
7.7%
Mortgage Type
FHA
Create a Home Valuation Report for This Property
The Home Valuation Report is an in-depth analysis detailing your home's value as well as a comparison with similar homes in the area
Home Values in the Area
Average Home Value in this Area
Purchase History
| Date | Buyer | Sale Price | Title Company |
|---|---|---|---|
| Witt Holdings Llc | $42,000 | Affinity Title Services Llc | |
| Galaxy Sites Llc | -- | Attorney | |
| Luna Rosalba | -- | Attorney | |
| Luna Rosalba | $108,000 | -- |
Source: Public Records
Mortgage History
| Date | Status | Borrower | Loan Amount |
|---|---|---|---|
| Previous Owner | Luna Rosalba | $107,822 |
Source: Public Records
Tax History Compared to Growth
Tax History
| Year | Tax Paid | Tax Assessment Tax Assessment Total Assessment is a certain percentage of the fair market value that is determined by local assessors to be the total taxable value of land and additions on the property. | Land | Improvement |
|---|---|---|---|---|
| 2024 | $4,606 | $56,147 | $5,807 | $50,340 |
| 2023 | $3,741 | $49,413 | $5,606 | $43,807 |
| 2022 | $3,741 | $38,732 | $5,476 | $33,256 |
| 2021 | $3,885 | $37,747 | $5,337 | $32,410 |
| 2020 | $4,027 | $36,022 | $5,093 | $30,929 |
| 2019 | $3,468 | $34,176 | $4,832 | $29,344 |
| 2018 | $3,366 | $25,673 | $5,760 | $19,913 |
| 2017 | $3,378 | $24,152 | $5,419 | $18,733 |
| 2016 | $3,085 | $26,336 | $5,159 | $21,177 |
| 2015 | $3,009 | $24,152 | $4,731 | $19,421 |
| 2014 | $4,047 | $30,404 | $9,134 | $21,270 |
| 2012 | $4,549 | $31,595 | $9,492 | $22,103 |
Source: Public Records
Map
Nearby Homes
- 3411 N Lewis Ave
- 3211 Rugby Ct
- 37966 N Cornell Rd
- 1730 W Beach Rd
- 3101 Country Club Ln
- 38683 N Lewis Ave
- 12582 W Beach Rd
- 38127 N Shore Ave
- 1636 Rice St
- 38362 N Manor Ave
- 11345 W Carnahan Ave
- 38697 N Cedar Ave
- 11342-11364 W Wadsworth Rd
- 37905 N Loyola Ave
- 38859 N Green Bay Rd
- 1612 Whitney St
- 12312 W Audrey Ave
- 2613 N Lewis Ave
- 12640 W Wadsworth Rd
- 39113 N Green Bay Rd
- 3521 Winhaven Dr
- 3535 Winhaven Dr
- 3526 Newcastle Rd
- 3517 Winhaven Dr
- 3516 Lorene Ct
- 3520 Newcastle Rd
- 3512 Lorene Ct
- 3528 Winhaven Dr Unit 2
- 3532 Winhaven Dr
- 3513 Winhaven Dr
- 3524 Winhaven Dr
- 3536 Winhaven Dr
- 3508 Lorene Ct
- 3520 Winhaven Dr
- 3540 Winhaven Dr
- 3509 Winhaven Dr
- 3504 Lorene Ct
- 3516 Winhaven Dr
- 3513 Newcastle Rd
- 3544 Winhaven Dr