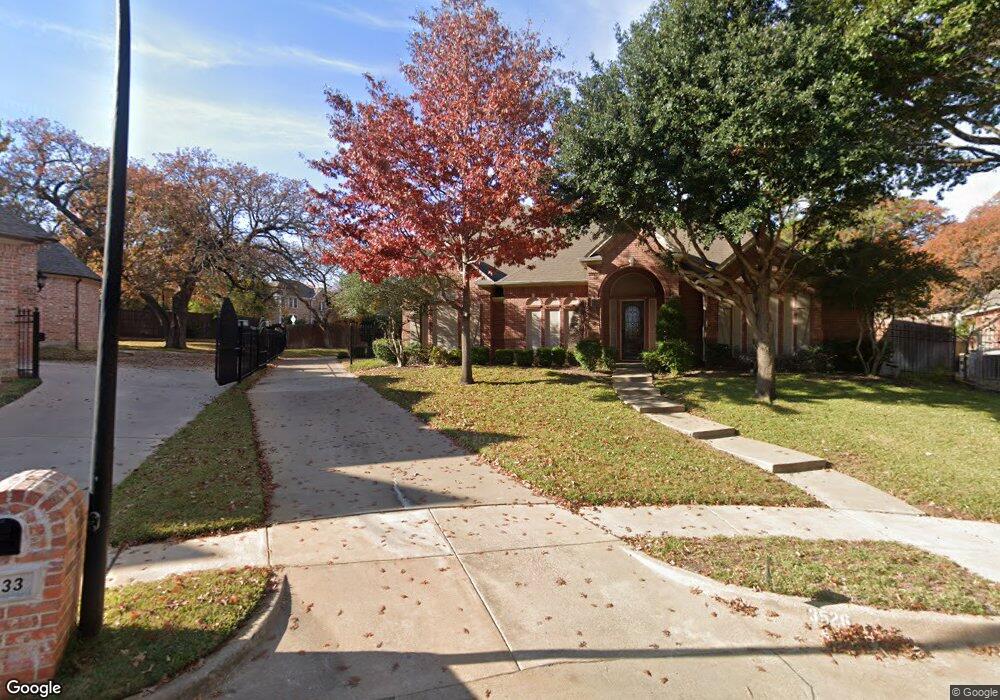
3526 Emerald Ct Grapevine, TX 76051
Estimated Value: $792,767 - $927,000
5
Beds
4
Baths
3,164
Sq Ft
$271/Sq Ft
Est. Value
About This Home
This home is located at 3526 Emerald Ct, Grapevine, TX 76051 and is currently estimated at $856,442, approximately $270 per square foot. 3526 Emerald Ct is a home located in Tarrant County with nearby schools including Heritage Elementary School, Cross Timbers Middle School, and Grapevine High School.
Ownership History
Date
Name
Owned For
Owner Type
Purchase Details
Closed on
Feb 20, 2006
Sold by
Dennis Alan L and Dennis Lara C
Bought by
Shelton Robert N and Shelton Toni T
Current Estimated Value
Home Financials for this Owner
Home Financials are based on the most recent Mortgage that was taken out on this home.
Original Mortgage
$294,400
Outstanding Balance
$164,259
Interest Rate
6.05%
Mortgage Type
Fannie Mae Freddie Mac
Estimated Equity
$692,183
Purchase Details
Closed on
Jul 24, 2000
Sold by
Marder Adam K and Marder Mary S
Bought by
Dennis Alan L and Dennis Lara C
Home Financials for this Owner
Home Financials are based on the most recent Mortgage that was taken out on this home.
Original Mortgage
$296,000
Interest Rate
8.21%
Purchase Details
Closed on
Apr 12, 1994
Sold by
Monument Property Company Inc
Bought by
Marder Adam K
Home Financials for this Owner
Home Financials are based on the most recent Mortgage that was taken out on this home.
Original Mortgage
$208,000
Interest Rate
7.61%
Create a Home Valuation Report for This Property
The Home Valuation Report is an in-depth analysis detailing your home's value as well as a comparison with similar homes in the area
Home Values in the Area
Average Home Value in this Area
Purchase History
| Date | Buyer | Sale Price | Title Company |
|---|---|---|---|
| Shelton Robert N | -- | Alamo Title Company | |
| Dennis Alan L | -- | Republic Title | |
| Marder Adam K | -- | Trinity Western Title Co |
Source: Public Records
Mortgage History
| Date | Status | Borrower | Loan Amount |
|---|---|---|---|
| Open | Shelton Robert N | $294,400 | |
| Previous Owner | Dennis Alan L | $296,000 | |
| Previous Owner | Marder Adam K | $208,000 |
Source: Public Records
Tax History
| Year | Tax Paid | Tax Assessment Tax Assessment Total Assessment is a certain percentage of the fair market value that is determined by local assessors to be the total taxable value of land and additions on the property. | Land | Improvement |
|---|---|---|---|---|
| 2025 | $2,652 | $657,000 | $192,650 | $464,350 |
| 2024 | $2,652 | $692,000 | $192,650 | $499,350 |
| 2023 | $8,467 | $714,213 | $192,650 | $521,563 |
| 2022 | $10,663 | $657,307 | $192,650 | $464,657 |
| 2021 | $10,639 | $489,300 | $115,590 | $373,710 |
| 2020 | $10,762 | $489,300 | $115,590 | $373,710 |
| 2019 | $11,080 | $485,860 | $100,000 | $385,860 |
| 2018 | $2,824 | $475,008 | $100,000 | $375,008 |
| 2017 | $9,986 | $431,825 | $100,000 | $331,825 |
| 2016 | $9,611 | $415,589 | $100,000 | $315,589 |
| 2015 | $8,217 | $377,800 | $45,000 | $332,800 |
| 2014 | $8,217 | $377,800 | $45,000 | $332,800 |
Source: Public Records
Map
Nearby Homes
- 2817 Kingswood Dr
- 3400 Wt Parr Rd
- 3502 Fieldwood St
- 2805 Pine View Dr
- 3028 Mountainview Ct
- 2706 Shady Hill Ct
- 3509 Hightimber Dr
- 3206 Wintergreen Terrace
- 3904 Wagon Wheel Dr
- 3920 Kelsey Ct
- 2504 Springhill Dr
- 2847 Oak Forest Dr
- 4019 Whitby Ln
- 3324 Lexington Ave
- 3233 High Meadow Dr
- 3205 Bridle Ln
- 2829 Southridge Dr
- 2609 Independence Rd
- 3602 Soft Wind Ct
- 2618 Pointe Ct
- 2833 Kingswood Dr
- 3522 Emerald Ct
- 2904 N Odell Ct
- 2829 Kingswood Dr
- 2850 N Odell Ct
- 3518 Emerald Ct
- 3400 Heritage Oak Ct
- 2912 N Odell Ct
- 3517 Emerald Ct
- 2830 N Odell Ct
- 2825 Kingswood Dr
- 3513 Emerald Ct
- 3514 Emerald Ct
- 3404 Heritage Oak Ct
- 3401 Heritage Oak Ct
- 2821 Kingswood Dr
- 3522 Windsor Forest Dr
- 2812 N Odell Ct
- 3510 Emerald Ct
- 2829 N Odell Ct
Your Personal Tour Guide
Ask me questions while you tour the home.