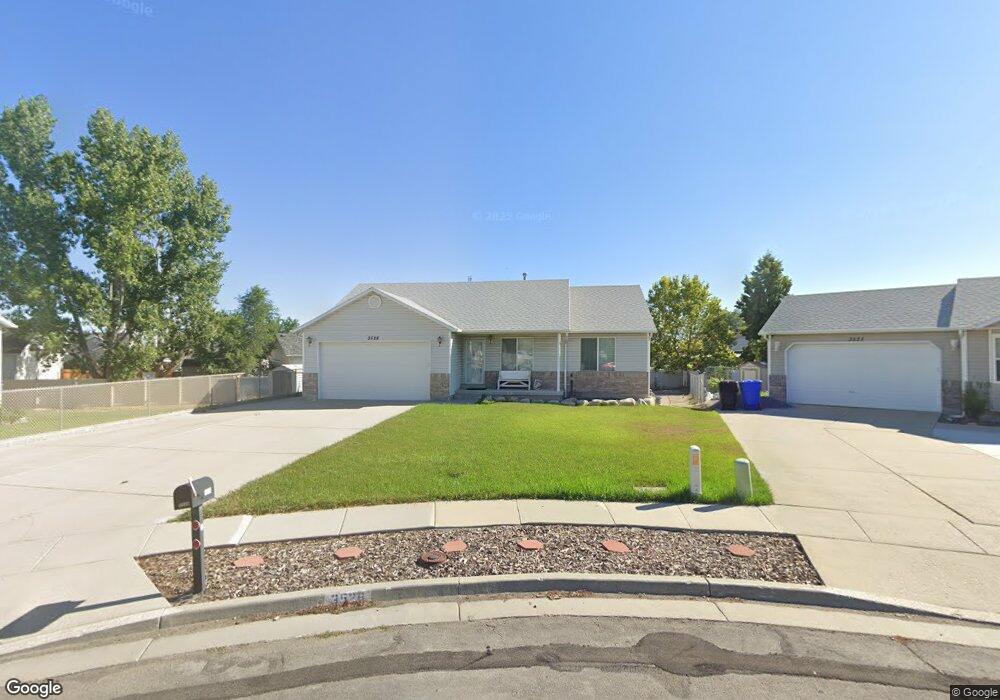
3528 Crab Apple Cir Salt Lake City, UT 84129
Estimated Value: $473,000 - $535,000
3
Beds
2
Baths
1,279
Sq Ft
$394/Sq Ft
Est. Value
About This Home
This home is located at 3528 Crab Apple Cir, Salt Lake City, UT 84129 and is currently estimated at $504,402, approximately $394 per square foot. 3528 Crab Apple Cir is a home located in Salt Lake County with nearby schools including Arcadia Elementary School, Bennion Junior High School, and Taylorsville High School.
Ownership History
Date
Name
Owned For
Owner Type
Purchase Details
Closed on
Jul 28, 2025
Sold by
Shire Marlene and Stewart Robin
Bought by
Marlene Shire Trust and Shire
Current Estimated Value
Purchase Details
Closed on
Nov 15, 2022
Sold by
Shire Marlene
Bought by
Shire Marlene and Stewart Robin
Purchase Details
Closed on
Sep 27, 2005
Sold by
Anderson Roger T
Bought by
Anderson Roger T and Anderson Tirzah
Purchase Details
Closed on
Sep 15, 1999
Sold by
Shire Marlene E
Bought by
Shire Marlene
Home Financials for this Owner
Home Financials are based on the most recent Mortgage that was taken out on this home.
Original Mortgage
$100,000
Interest Rate
7.43%
Purchase Details
Closed on
May 27, 1999
Sold by
D R Horton Inc
Bought by
Shire Marlen E
Home Financials for this Owner
Home Financials are based on the most recent Mortgage that was taken out on this home.
Original Mortgage
$53,000
Interest Rate
6.86%
Create a Home Valuation Report for This Property
The Home Valuation Report is an in-depth analysis detailing your home's value as well as a comparison with similar homes in the area
Home Values in the Area
Average Home Value in this Area
Purchase History
| Date | Buyer | Sale Price | Title Company |
|---|---|---|---|
| Marlene Shire Trust | -- | None Listed On Document | |
| Marlene Shire Trust | -- | None Listed On Document | |
| Shire Marlene | -- | -- | |
| Anderson Roger T | -- | Accommodation | |
| Shire Marlene | -- | Security Title Ins Agency | |
| Shire Marlen E | -- | Backman Stewart Title Servic |
Source: Public Records
Mortgage History
| Date | Status | Borrower | Loan Amount |
|---|---|---|---|
| Previous Owner | Shire Marlene | $100,000 | |
| Previous Owner | Shire Marlen E | $53,000 |
Source: Public Records
Tax History Compared to Growth
Tax History
| Year | Tax Paid | Tax Assessment Tax Assessment Total Assessment is a certain percentage of the fair market value that is determined by local assessors to be the total taxable value of land and additions on the property. | Land | Improvement |
|---|---|---|---|---|
| 2025 | $2,864 | $496,800 | $115,800 | $381,000 |
| 2024 | $2,864 | $469,600 | $109,500 | $360,100 |
| 2023 | $2,763 | $444,500 | $105,300 | $339,200 |
| 2022 | $2,747 | $445,700 | $103,300 | $342,400 |
| 2021 | $2,560 | $361,800 | $79,500 | $282,300 |
| 2020 | $2,361 | $315,800 | $72,700 | $243,100 |
| 2019 | $2,312 | $301,900 | $67,400 | $234,500 |
| 2018 | $2,171 | $273,300 | $67,400 | $205,900 |
| 2017 | $1,947 | $257,700 | $67,400 | $190,300 |
| 2016 | $1,772 | $234,300 | $67,400 | $166,900 |
| 2015 | $1,650 | $203,900 | $74,800 | $129,100 |
| 2014 | $1,529 | $185,600 | $68,800 | $116,800 |
Source: Public Records
Map
Nearby Homes
- 3507 W 4700 S
- 3546 W Franco Ct Unit 3
- 3657 W 4700 S Unit A
- 4624 S Harrisonwood Cir
- 3639 W Jasmine St
- 3288 W 4700 S
- 3506 4970 S
- 3692 Jasmine St
- 3238 W 4630 S
- 3838 W Kinglassie Ln
- 3839 W Mossmorran Ln
- 3844 W Gartmore Ln Unit 208
- 3574 W Kathy Ave
- 3055 Westcove Dr
- 5161 S 3600 W
- 3536 W Churchwood Dr
- 3620 W 5180 S Unit 1 H
- 3947 Ridgeview Way
- 3588 W Churchwood Dr
- 4392 S 3680 W
- 3527 W Dutch Apple Cove Unit 11
- 3522 Crab Apple Cir
- 3522 W Crab Apple Cir
- 3527 Dutch Apple Cove
- 3536 Crab Apple Cir
- 3537 Dutch Apple Cove
- 3537 W Dutch Apple Cove Unit 12
- 3537 W Dutch Apple Cove
- 4770 Dymock Cir
- 3523 W Dutch Apple Cove
- 3523 Dutch Apple Cove
- 4760 Dymock Cir
- 4760 S Dymock Cir
- 3521 Crab Apple Cir
- 3548 W Crab Apple Cir
- 4780 Dymock Cir
- 3548 Crab Apple Cir
- 3548 W Crab Apple Cir Unit 14
- 3548 W Crab Apple Cir
- 4754 Dymock Cir