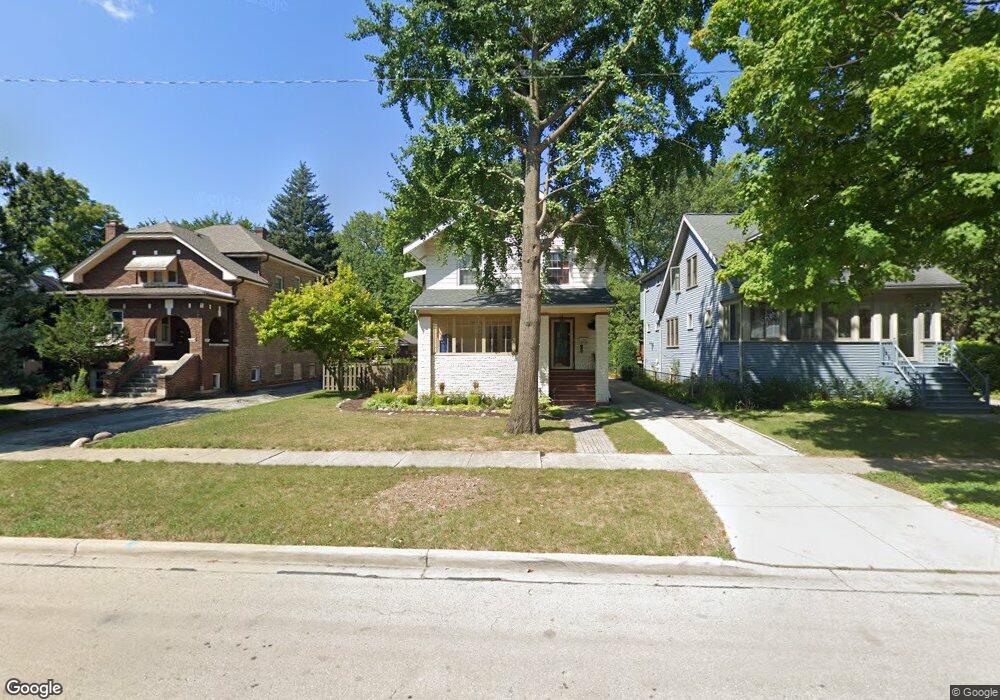
3528 Mccormick Ave Brookfield, IL 60513
Estimated Value: $462,000 - $577,000
3
Beds
2
Baths
2,198
Sq Ft
$240/Sq Ft
Est. Value
About This Home
This home is located at 3528 Mccormick Ave, Brookfield, IL 60513 and is currently estimated at $526,828, approximately $239 per square foot. 3528 Mccormick Ave is a home located in Cook County with nearby schools including Hollywood Elementary School, L J Hauser Jr High School, and Riverside Brookfield High School.
Ownership History
Date
Name
Owned For
Owner Type
Purchase Details
Closed on
Aug 31, 2006
Sold by
Walla Theresa
Bought by
Ambrosia Anthony R and Ambrosia Melissa N
Current Estimated Value
Home Financials for this Owner
Home Financials are based on the most recent Mortgage that was taken out on this home.
Original Mortgage
$368,000
Outstanding Balance
$217,608
Interest Rate
6.77%
Mortgage Type
Unknown
Estimated Equity
$309,220
Purchase Details
Closed on
Nov 12, 2003
Sold by
Montalbano James
Bought by
Walla Theresa
Home Financials for this Owner
Home Financials are based on the most recent Mortgage that was taken out on this home.
Original Mortgage
$227,500
Interest Rate
4%
Mortgage Type
Unknown
Purchase Details
Closed on
Jul 19, 1996
Sold by
Blondell James M and Blondell Marquerite
Bought by
Montalbano James and Walla Theresa
Home Financials for this Owner
Home Financials are based on the most recent Mortgage that was taken out on this home.
Original Mortgage
$110,000
Interest Rate
8.31%
Create a Home Valuation Report for This Property
The Home Valuation Report is an in-depth analysis detailing your home's value as well as a comparison with similar homes in the area
Home Values in the Area
Average Home Value in this Area
Purchase History
| Date | Buyer | Sale Price | Title Company |
|---|---|---|---|
| Ambrosia Anthony R | $460,000 | None Available | |
| Walla Theresa | -- | Rei | |
| Montalbano James | $190,000 | -- |
Source: Public Records
Mortgage History
| Date | Status | Borrower | Loan Amount |
|---|---|---|---|
| Open | Ambrosia Anthony R | $368,000 | |
| Previous Owner | Walla Theresa | $227,500 | |
| Previous Owner | Montalbano James | $110,000 |
Source: Public Records
Tax History
| Year | Tax Paid | Tax Assessment Tax Assessment Total Assessment is a certain percentage of the fair market value that is determined by local assessors to be the total taxable value of land and additions on the property. | Land | Improvement |
|---|---|---|---|---|
| 2025 | $15,198 | $47,000 | $19,332 | $27,668 |
| 2024 | $15,198 | $47,000 | $19,332 | $27,668 |
| 2023 | $13,055 | $47,000 | $19,332 | $27,668 |
| 2022 | $13,055 | $34,806 | $16,647 | $18,159 |
| 2021 | $12,624 | $34,805 | $16,647 | $18,158 |
| 2020 | $12,340 | $34,805 | $16,647 | $18,158 |
| 2019 | $13,673 | $38,658 | $15,036 | $23,622 |
| 2018 | $13,055 | $38,658 | $15,036 | $23,622 |
| 2017 | $12,501 | $38,658 | $15,036 | $23,622 |
| 2016 | $11,701 | $33,599 | $12,888 | $20,711 |
| 2015 | $11,203 | $33,599 | $12,888 | $20,711 |
| 2014 | $11,048 | $33,599 | $12,888 | $20,711 |
| 2013 | $10,249 | $33,747 | $12,888 | $20,859 |
Source: Public Records
Map
Nearby Homes
- 213 W Quincy St Unit 1
- 8424 Greenview Ave
- 3845 Mccormick Ave
- 3901 Custer Ave
- 3545 Oak Ave
- 3708 Sunnyside Ave
- 8636 40th St
- 124 Forest Ave
- 201 Scottswood Rd
- 4040 Rose Ave
- 9031 Fairview Ave
- 336 Fairbank Rd
- 4053 Rose Ave
- 78 Pine Ave
- 9016 Southview Ave
- 4038 Grove Ave
- 220 Maplewood Rd
- 236 Maplewood Rd
- 3236 Park Ave
- 8803 Ogden Ave
- 3526 Mccormick Ave
- 3532 Mccormick Ave
- 3520 Mccormick Ave
- 3544 Mccormick Ave
- 3514 Mccormick Ave
- 3529 Mccormick Ave
- 3525 Mccormick Ave
- 3531 Mccormick Ave
- 3550 Mccormick Ave
- 3521 Mccormick Ave
- 3512 Mccormick Ave
- 3545 Mccormick Ave
- 3515 Mccormick Ave
- 3547 Mccormick Ave
- 3506 Mccormick Ave
- 8626 Parkview Ave
- 3511 Mccormick Ave
- 8615 Washington Ave
- 3505 Mccormick Ave
- 8540 Parkview Ave
Your Personal Tour Guide
Ask me questions while you tour the home.