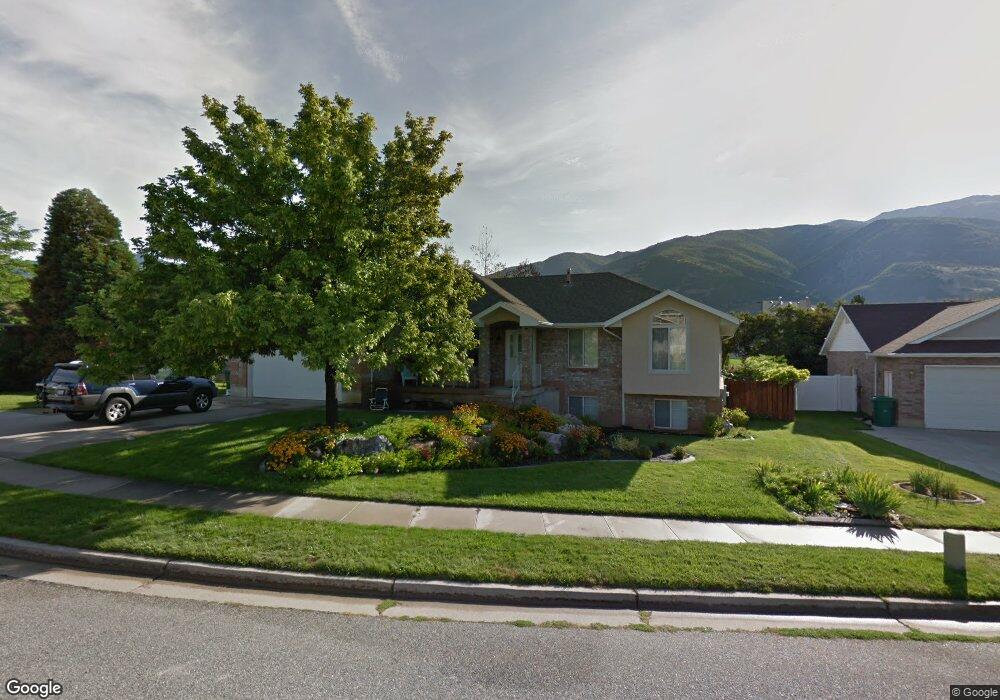
3528 N 2175 E Layton, UT 84040
Estimated Value: $595,000 - $638,647
5
Beds
3
Baths
3,553
Sq Ft
$176/Sq Ft
Est. Value
About This Home
This home is located at 3528 N 2175 E, Layton, UT 84040 and is currently estimated at $625,412, approximately $176 per square foot. 3528 N 2175 E is a home located in Davis County with nearby schools including Mountain View Elementary School, North Layton Junior High School, and Northridge High School.
Ownership History
Date
Name
Owned For
Owner Type
Purchase Details
Closed on
Mar 13, 2017
Sold by
Berrett Shane L and Berrett Adrienne J
Bought by
White Michael
Current Estimated Value
Home Financials for this Owner
Home Financials are based on the most recent Mortgage that was taken out on this home.
Original Mortgage
$354,050
Outstanding Balance
$293,956
Interest Rate
4.3%
Mortgage Type
New Conventional
Estimated Equity
$331,456
Purchase Details
Closed on
Jul 31, 2009
Sold by
Matsumura Brett E and Matsumura Eileen M
Bought by
Berrett Shane L and Berrett Adrienne J
Home Financials for this Owner
Home Financials are based on the most recent Mortgage that was taken out on this home.
Original Mortgage
$228,000
Interest Rate
5.3%
Mortgage Type
Purchase Money Mortgage
Create a Home Valuation Report for This Property
The Home Valuation Report is an in-depth analysis detailing your home's value as well as a comparison with similar homes in the area
Home Values in the Area
Average Home Value in this Area
Purchase History
| Date | Buyer | Sale Price | Title Company |
|---|---|---|---|
| White Michael | -- | Founders Title | |
| Berrett Shane L | -- | Backman Title Service |
Source: Public Records
Mortgage History
| Date | Status | Borrower | Loan Amount |
|---|---|---|---|
| Open | White Michael | $354,050 | |
| Previous Owner | Berrett Shane L | $228,000 |
Source: Public Records
Tax History
| Year | Tax Paid | Tax Assessment Tax Assessment Total Assessment is a certain percentage of the fair market value that is determined by local assessors to be the total taxable value of land and additions on the property. | Land | Improvement |
|---|---|---|---|---|
| 2025 | $3,554 | $343,200 | $131,827 | $211,373 |
| 2024 | $3,373 | $330,550 | $154,337 | $176,213 |
| 2023 | $3,410 | $596,000 | $152,899 | $443,101 |
| 2022 | $3,552 | $339,350 | $81,273 | $258,077 |
| 2021 | $3,269 | $465,000 | $131,140 | $333,860 |
| 2020 | $2,996 | $408,000 | $105,535 | $302,465 |
| 2019 | $2,874 | $385,000 | $107,903 | $277,097 |
| 2018 | $2,655 | $357,000 | $106,542 | $250,458 |
| 2016 | $2,363 | $166,430 | $42,997 | $123,433 |
| 2015 | $2,246 | $150,975 | $42,997 | $107,978 |
| 2014 | $2,264 | $156,851 | $42,997 | $113,854 |
| 2013 | -- | $151,911 | $37,540 | $114,371 |
Source: Public Records
Map
Nearby Homes
- 3232 N Redtail Way
- 1827 E Whitetail Dr
- 2353 Canyon View Dr
- 1821 E Whitetail Way
- 1935 Deere Valley Dr
- 2357 E 8100 S
- 1785 E 2825 N
- 1731 E 2825 N
- 7886 S 2100 E
- 3297 N Layton Ridge Dr
- 3176 N 1450 E
- 2826 N 1600 E
- 2597 N 2300 E
- 8036 S 2575 E
- 1321 E 3125 N
- 2586 Deer Run Dr
- 7841 Peachwood Dr
- 1266 E 3125 N
- 1241 E 3075 N
- 2204 E View Dr
Your Personal Tour Guide
Ask me questions while you tour the home.