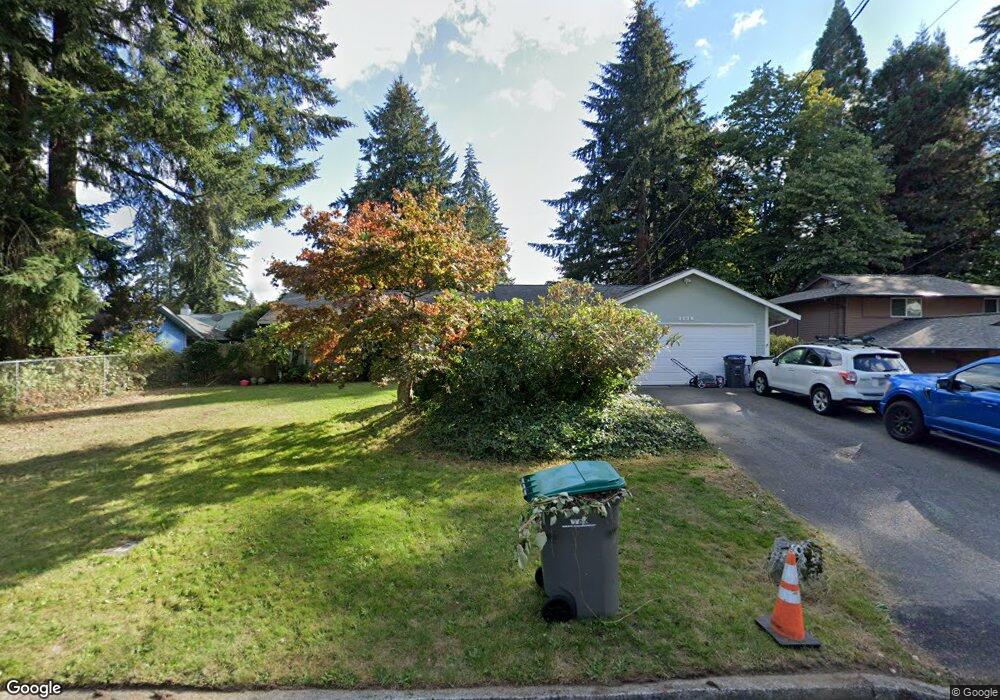
3528 SE Pine Tree Dr Port Orchard, WA 98366
Parkwood NeighborhoodEstimated Value: $478,000 - $512,000
3
Beds
1
Bath
1,944
Sq Ft
$255/Sq Ft
Est. Value
About This Home
This home is located at 3528 SE Pine Tree Dr, Port Orchard, WA 98366 and is currently estimated at $495,051, approximately $254 per square foot. 3528 SE Pine Tree Dr is a home located in Kitsap County with nearby schools including Orchard Heights Elementary School, Marcus Whitman Middle School, and South Kitsap High School.
Ownership History
Date
Name
Owned For
Owner Type
Purchase Details
Closed on
May 23, 2025
Sold by
Deboer Bea C
Bought by
Wolff Alena
Current Estimated Value
Purchase Details
Closed on
Nov 6, 2019
Sold by
Deboer Roy J and Deboer Bea C
Bought by
Deboer Roy J and Deboer Bea C
Create a Home Valuation Report for This Property
The Home Valuation Report is an in-depth analysis detailing your home's value as well as a comparison with similar homes in the area
Home Values in the Area
Average Home Value in this Area
Purchase History
| Date | Buyer | Sale Price | Title Company |
|---|---|---|---|
| Wolff Alena | $313 | None Listed On Document | |
| Deboer Roy J | -- | None Available |
Source: Public Records
Tax History Compared to Growth
Tax History
| Year | Tax Paid | Tax Assessment Tax Assessment Total Assessment is a certain percentage of the fair market value that is determined by local assessors to be the total taxable value of land and additions on the property. | Land | Improvement |
|---|---|---|---|---|
| 2026 | $2 | $487,220 | $75,600 | $411,620 |
| 2025 | $3,944 | $448,490 | $63,600 | $384,890 |
| 2024 | $3,825 | $448,490 | $63,600 | $384,890 |
| 2023 | $3,800 | $448,490 | $63,600 | $384,890 |
| 2022 | $3,717 | $367,660 | $59,390 | $308,270 |
| 2021 | $3,598 | $336,730 | $55,190 | $281,540 |
| 2020 | $3,536 | $321,630 | $52,560 | $269,070 |
| 2019 | $2,889 | $287,500 | $51,600 | $235,900 |
| 2018 | $3,019 | $232,850 | $51,600 | $181,250 |
| 2017 | $2,580 | $232,850 | $51,600 | $181,250 |
| 2016 | $2,513 | $207,520 | $51,600 | $155,920 |
| 2015 | $2,432 | $203,520 | $51,600 | $151,920 |
| 2014 | -- | $199,520 | $51,600 | $147,920 |
| 2013 | -- | $194,440 | $54,320 | $140,120 |
Source: Public Records
Map
Nearby Homes
- 2017 SE Juniper Ct
- 2116 Pine Tree Dr SE
- 2124 Pine Tree Dr SE
- 1663 Harrison Ave SE
- 0 Wendell Ave SE
- 4990 Mile Hill Dr
- 2014 Kelowna Place SE
- 3900 SE Mile Hill Dr
- 2475 Parkwood Dr SE
- 3930 SE Mile Hill Dr
- 2949 SE Mile Hill Dr Unit C7
- 2949 SE Mile Hill Dr Unit C-2
- 2457 White Cedar Dr SE
- 4010 SE Lovell St
- 2235 Eisenhower Ave SE
- 2808 Pine Cone Ct SE
- 3884 Madrona Dr SE
- 4258 SE Woodford Ct
- 2313 Lincoln Ave SE
- 0 Lincoln Ave SE
- 3510 SE Pine Tree Dr
- 1862 SE Sequoia St
- 1898 SE Sequoia St
- 3494 SE Pine Tree Dr
- 2018 SE Juniper Ct
- 3537 SE Pine Tree Dr
- 3521 SE Pine Tree Dr
- 3555 SE Pine Tree Dr
- 1922 SE Sequoia St
- 3503 SE Pine Tree Dr
- 3578 SE Pine Tree Dr
- 3454 SE Pine Tree Dr
- 1891 SE Sequoia St
- 2013 SE Juniper Ct
- 3487 Pine Tree Dr SE
- 3571 SE Pine Tree Dr
- 2014 SE Juniper Ct
- 3438 SE Pine Tree Dr
- 1917 SE Sequoia St