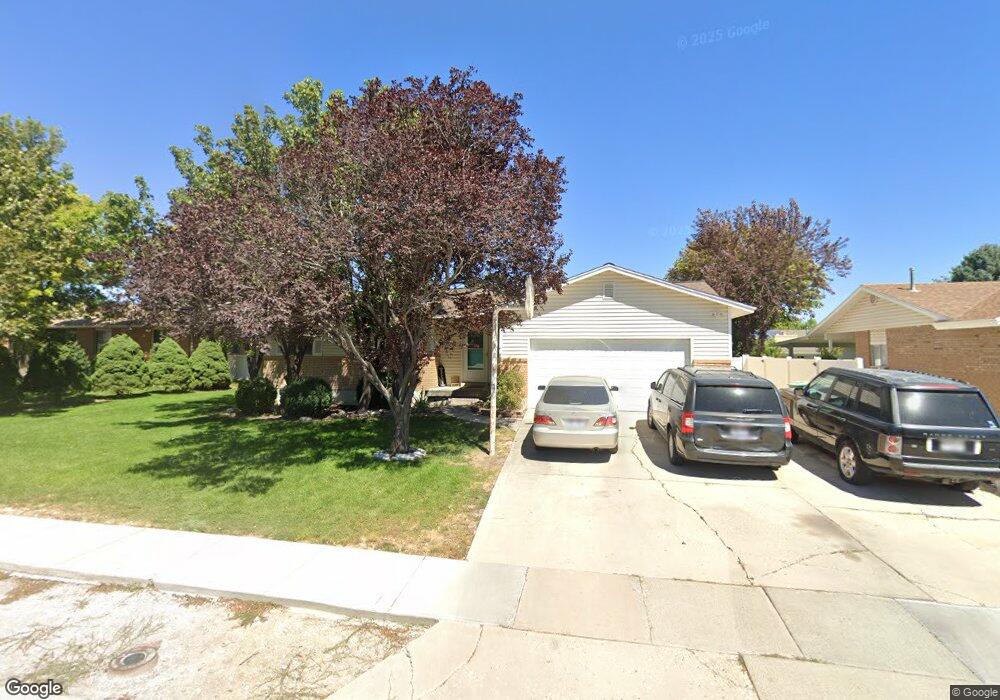
3528 W Fenchurch Rd West Jordan, UT 84084
Estimated Value: $506,000 - $552,000
5
Beds
2
Baths
2,334
Sq Ft
$225/Sq Ft
Est. Value
About This Home
This home is located at 3528 W Fenchurch Rd, West Jordan, UT 84084 and is currently estimated at $524,058, approximately $224 per square foot. 3528 W Fenchurch Rd is a home located in Salt Lake County with nearby schools including Oquirrh Elementary School, Joel P. Jensen Middle School, and West Jordan High School.
Ownership History
Date
Name
Owned For
Owner Type
Purchase Details
Closed on
Jan 16, 2002
Sold by
Chase Mtg Holdings Inc
Bought by
Parry Jared B and Parry Jamie D
Current Estimated Value
Home Financials for this Owner
Home Financials are based on the most recent Mortgage that was taken out on this home.
Original Mortgage
$126,022
Outstanding Balance
$51,901
Interest Rate
7.15%
Mortgage Type
FHA
Estimated Equity
$472,157
Purchase Details
Closed on
Nov 1, 2001
Sold by
Paraso Ariel and Paraso Debra L
Bought by
Chase Mtg Holdings Inc
Purchase Details
Closed on
May 23, 1996
Sold by
Wilkes Jeffery S and Wilkes Wendy
Bought by
Paraso Ariel and Paraso Debra L
Home Financials for this Owner
Home Financials are based on the most recent Mortgage that was taken out on this home.
Original Mortgage
$127,147
Interest Rate
7.97%
Mortgage Type
FHA
Create a Home Valuation Report for This Property
The Home Valuation Report is an in-depth analysis detailing your home's value as well as a comparison with similar homes in the area
Home Values in the Area
Average Home Value in this Area
Purchase History
| Date | Buyer | Sale Price | Title Company |
|---|---|---|---|
| Parry Jared B | -- | First American Title | |
| Chase Mtg Holdings Inc | $123,250 | Backman Stewart Title Servic | |
| Paraso Ariel | -- | -- |
Source: Public Records
Mortgage History
| Date | Status | Borrower | Loan Amount |
|---|---|---|---|
| Open | Parry Jared B | $126,022 | |
| Previous Owner | Paraso Ariel | $127,147 |
Source: Public Records
Tax History Compared to Growth
Tax History
| Year | Tax Paid | Tax Assessment Tax Assessment Total Assessment is a certain percentage of the fair market value that is determined by local assessors to be the total taxable value of land and additions on the property. | Land | Improvement |
|---|---|---|---|---|
| 2025 | $2,466 | $491,800 | $126,200 | $365,600 |
| 2024 | $2,466 | $474,500 | $122,000 | $352,500 |
| 2023 | $2,315 | $419,800 | $117,300 | $302,500 |
| 2022 | $2,404 | $428,800 | $115,000 | $313,800 |
| 2021 | $2,027 | $329,200 | $91,000 | $238,200 |
| 2020 | $1,884 | $287,200 | $85,000 | $202,200 |
| 2019 | $1,870 | $279,500 | $85,000 | $194,500 |
| 2018 | $1,679 | $248,900 | $80,300 | $168,600 |
| 2017 | $1,583 | $233,600 | $80,300 | $153,300 |
| 2016 | $1,536 | $213,000 | $80,300 | $132,700 |
| 2015 | $1,546 | $209,000 | $81,900 | $127,100 |
| 2014 | $1,483 | $197,400 | $78,000 | $119,400 |
Source: Public Records
Map
Nearby Homes
- 3422 Briar Dr
- 7611 S Springbrook Dr
- 7122 S Wood Green Rd
- 3354 W 7800 S
- 3629 W 7825 S
- 7604 S Autumn Dr
- 3476 W Spaulding Rd
- 3647 W 7865 S
- 3165 W 7720 S
- 6980 S 3535 W Unit 2
- 6968 S 3535 W Unit 3
- 6992 W Terraine Rd
- 6978 W Terraine Rd
- 2886 W 7550 S
- 3546 W 7980 S
- 6894 S 3420 W
- 3383 W 6880 S
- 7989 S 3725 W
- 7991 S 3725 W
- 6863 S Dixie Dr
- 3528 Fenchurch Rd
- 3520 Fenchurch Rd
- 3536 Fenchurch Rd
- 3527 Charing Cross Rd
- 3535 W Charing Cross Rd
- 3535 Charing Cross Rd
- 3221 W Charing Cross Cir
- 3519 Charing Cross Rd
- 3519 W Charing Cross Rd
- 3527 W Fenchurch Rd
- 3527 Fenchurch Rd
- 3512 W Fenchurch Rd
- 3512 Fenchurch Rd
- 3540 W Fenchurch Rd
- 3540 Fenchurch Rd
- 3519 W Fenchurch Rd
- 3519 Fenchurch Rd
- 3535 Fenchurch Rd
- 7456 Woodgreen Rd
- 3543 W Charing Cross Rd