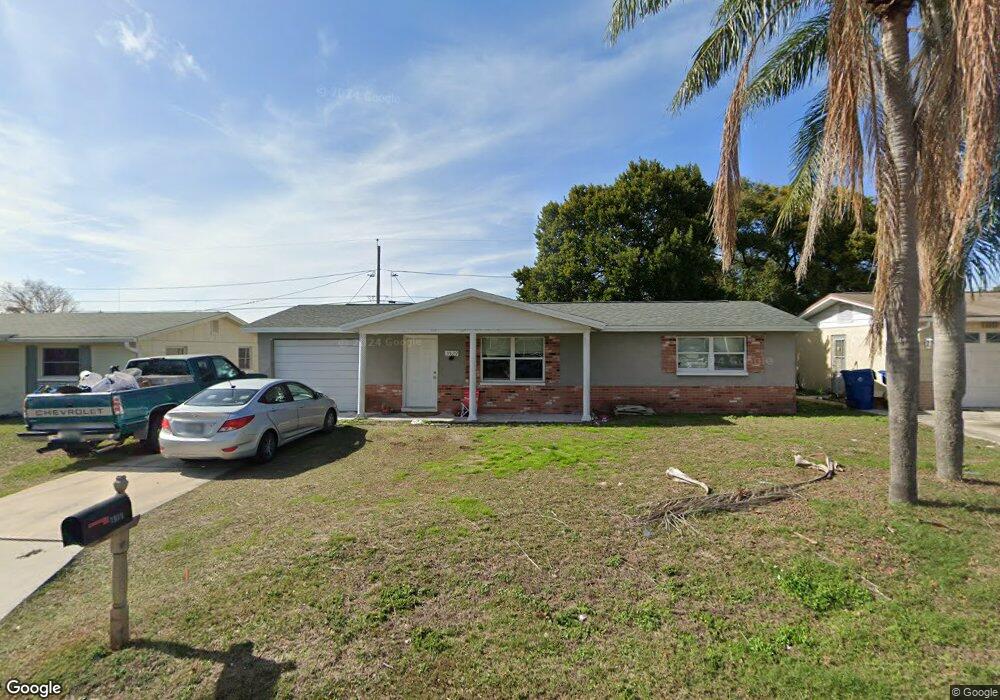
3529 Cambridge St New Port Richey, FL 34652
Estimated Value: $184,000 - $238,000
2
Beds
2
Baths
1,576
Sq Ft
$129/Sq Ft
Est. Value
About This Home
This home is located at 3529 Cambridge St, New Port Richey, FL 34652 and is currently estimated at $203,571, approximately $129 per square foot. 3529 Cambridge St is a home located in Pasco County with nearby schools including Anclote Elementary School, Gulf Middle School, and Gulf High School.
Ownership History
Date
Name
Owned For
Owner Type
Purchase Details
Closed on
Jul 18, 2017
Sold by
Jankowski Mark
Bought by
Mj Holdiay Holdings Llc
Current Estimated Value
Purchase Details
Closed on
Jul 1, 2017
Bought by
Mj Holiday Holdings Llc
Purchase Details
Closed on
May 18, 2015
Sold by
The Bank Of New York Mellon
Bought by
Jankowski Mark
Purchase Details
Closed on
Mar 26, 2015
Sold by
Menard Linda R and Menard Ronald C
Bought by
The Bank Of New York Mellon and The Bank Of New York
Purchase Details
Closed on
Mar 2, 1999
Sold by
Zuban Joseph and Law Julia
Bought by
Menard Ronald C and Menard Linda R
Home Financials for this Owner
Home Financials are based on the most recent Mortgage that was taken out on this home.
Original Mortgage
$36,000
Interest Rate
6.84%
Mortgage Type
New Conventional
Purchase Details
Closed on
Dec 30, 1998
Sold by
Zuban Joseph
Bought by
Zuban Joseph and Law Julia
Create a Home Valuation Report for This Property
The Home Valuation Report is an in-depth analysis detailing your home's value as well as a comparison with similar homes in the area
Home Values in the Area
Average Home Value in this Area
Purchase History
| Date | Buyer | Sale Price | Title Company |
|---|---|---|---|
| Mj Holdiay Holdings Llc | -- | Attorney | |
| Mj Holiday Holdings Llc | $100 | -- | |
| Jankowski Mark | $35,000 | None Available | |
| The Bank Of New York Mellon | -- | None Available | |
| Menard Ronald C | $45,000 | -- | |
| Zuban Joseph | $100 | -- |
Source: Public Records
Mortgage History
| Date | Status | Borrower | Loan Amount |
|---|---|---|---|
| Previous Owner | Zuban Joseph | $36,000 |
Source: Public Records
Tax History Compared to Growth
Tax History
| Year | Tax Paid | Tax Assessment Tax Assessment Total Assessment is a certain percentage of the fair market value that is determined by local assessors to be the total taxable value of land and additions on the property. | Land | Improvement |
|---|---|---|---|---|
| 2025 | $2,241 | $142,878 | $33,566 | $109,312 |
| 2024 | $2,241 | $151,183 | $31,450 | $119,733 |
| 2023 | $2,324 | $90,650 | $0 | $0 |
| 2022 | $1,873 | $105,968 | $20,966 | $85,002 |
| 2021 | $1,734 | $92,266 | $16,632 | $75,634 |
| 2020 | $1,531 | $72,977 | $10,735 | $62,242 |
| 2019 | $1,472 | $73,241 | $10,735 | $62,506 |
| 2018 | $1,132 | $62,142 | $10,735 | $51,407 |
| 2017 | $1,036 | $52,337 | $10,735 | $41,602 |
| 2016 | $922 | $46,528 | $10,735 | $35,793 |
| 2015 | $844 | $41,001 | $10,735 | $30,266 |
| 2014 | $759 | $37,217 | $10,080 | $27,137 |
Source: Public Records
Map
Nearby Homes
- 3522 Cambridge St
- 3420 Lanark Dr
- 3346 Chatford Dr
- 3348 Lanark Dr
- 3426 Blayton St
- 4715 Manor Dr
- 3342 Lanark Dr
- 5122 Dove Dr
- 5120 Cicero Dr
- 3317 Hampshire Dr
- 4819 Beacon Hill Dr
- 4906 Uranus Ave
- 4634 Salem Dr
- 3542 Connon Dr
- 5137 Manor Dr
- 3640 Connon Dr
- 5200 Dove Dr
- 3244 Hampshire Dr
- 3245 Lanark Dr
- 3547 Morley Dr
- 3535 Cambridge St Unit 5
- 3528 Hendrix St
- 3534 Hendrix St
- 3522 Hendrix St
- 3517 Cambridge St Unit 5
- 3543 Cambridge St
- 3528 Cambridge St
- 3542 Hendrix St
- 3516 Hendrix St
- 3534 Cambridge St
- 3516 Cambridge St
- 3549 Cambridge St
- 3542 Cambridge St
- 3548 Hendrix St
- 3529 Hendrix St
- 3529 Linkwood St
- 3510 Cambridge St
- 3535 Hendrix St
- 3523 Linkwood St
- 3523 Hendrix St