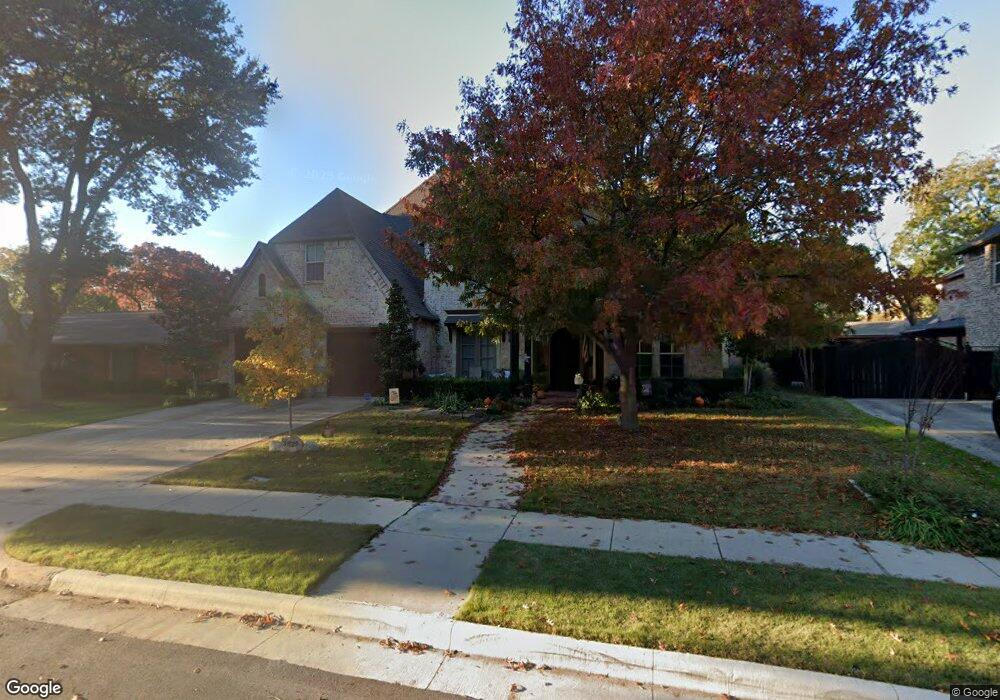
3529 Flaxley Dr Dallas, TX 75229
Westhollow NeighborhoodEstimated Value: $877,000 - $1,319,000
4
Beds
5
Baths
4,316
Sq Ft
$250/Sq Ft
Est. Value
About This Home
This home is located at 3529 Flaxley Dr, Dallas, TX 75229 and is currently estimated at $1,080,471, approximately $250 per square foot. 3529 Flaxley Dr is a home located in Dallas County with nearby schools including Everette Lee DeGolyer Elementary School, Thomas C. Marsh Middle School, and W T White High School.
Ownership History
Date
Name
Owned For
Owner Type
Purchase Details
Closed on
Mar 25, 2010
Sold by
N M & L Enterprises Lp
Bought by
Vardaman Lee Q and Vardaman Jane M
Current Estimated Value
Home Financials for this Owner
Home Financials are based on the most recent Mortgage that was taken out on this home.
Original Mortgage
$417,000
Outstanding Balance
$262,526
Interest Rate
4%
Mortgage Type
New Conventional
Estimated Equity
$817,945
Purchase Details
Closed on
Dec 4, 2007
Sold by
Pomeroy Gregory and Pack Heidi
Bought by
N M & L Enterprises Lp
Home Financials for this Owner
Home Financials are based on the most recent Mortgage that was taken out on this home.
Original Mortgage
$109,000
Interest Rate
6.4%
Mortgage Type
Purchase Money Mortgage
Create a Home Valuation Report for This Property
The Home Valuation Report is an in-depth analysis detailing your home's value as well as a comparison with similar homes in the area
Home Values in the Area
Average Home Value in this Area
Purchase History
| Date | Buyer | Sale Price | Title Company |
|---|---|---|---|
| Vardaman Lee Q | -- | None Available | |
| N M & L Enterprises Lp | -- | Alamo Title Company | |
| N M & L Enterprises Lp | -- | Alamo Title Company |
Source: Public Records
Mortgage History
| Date | Status | Borrower | Loan Amount |
|---|---|---|---|
| Open | Vardaman Lee Q | $417,000 | |
| Previous Owner | N M & L Enterprises Lp | $109,000 |
Source: Public Records
Tax History Compared to Growth
Tax History
| Year | Tax Paid | Tax Assessment Tax Assessment Total Assessment is a certain percentage of the fair market value that is determined by local assessors to be the total taxable value of land and additions on the property. | Land | Improvement |
|---|---|---|---|---|
| 2025 | $8,395 | $889,510 | $400,000 | $489,510 |
| 2024 | $8,395 | $767,960 | $295,000 | $472,960 |
| 2023 | $8,395 | $708,280 | $240,000 | $468,280 |
| 2022 | $17,203 | $688,010 | $240,000 | $448,010 |
| 2021 | $16,372 | $620,630 | $180,000 | $440,630 |
| 2020 | $16,837 | $620,630 | $180,000 | $440,630 |
| 2019 | $17,658 | $620,630 | $180,000 | $440,630 |
| 2018 | $11,166 | $620,630 | $180,000 | $440,630 |
| 2017 | $16,061 | $590,630 | $150,000 | $440,630 |
| 2016 | $14,855 | $546,280 | $125,000 | $421,280 |
| 2015 | $11,041 | $531,660 | $110,000 | $421,660 |
| 2014 | $11,041 | $559,270 | $110,000 | $449,270 |
Source: Public Records
Map
Nearby Homes
- 10419 Cromwell Dr
- 3609 Warick Dr
- 3605 Merrell Rd
- 3627 Merrell Rd
- 3645 Warick Dr
- 3448 Rosebud Park Ln
- 3639 Norcross Ln
- 3528 Woodleigh Dr
- 3581 Woodleigh Dr
- 10207 Marsh Ln
- 10565 Cromwell Dr
- 3343 Norcross Ln
- 3320 Norcross Ln
- 3262 Camelot Dr
- 3619 Rickshaw Dr
- 3236 Merrell Rd
- 3542 Regent Dr
- 3222 Norcross Ln
- 3239 Whirlaway Rd
- 3534 Royal Ln
- 3535 Flaxley Dr
- 3543 Flaxley Dr
- 3523 Flaxley Dr
- 3524 Merrell Rd
- 3532 Merrell Rd
- 3534 Flaxley Dr
- 3528 Flaxley Dr
- 3516 Merrell Rd
- 3538 Merrell Rd
- 3544 Flaxley Dr
- 3515 Flaxley Dr
- 3551 Flaxley Dr
- 10322 Cromwell Dr
- 3522 Flaxley Dr
- 10330 Cromwell Dr
- 3546 Merrell Rd
- 3552 Flaxley Dr
- 3535 Timberview Rd
- 3508 Merrell Rd
- 3507 Flaxley Dr