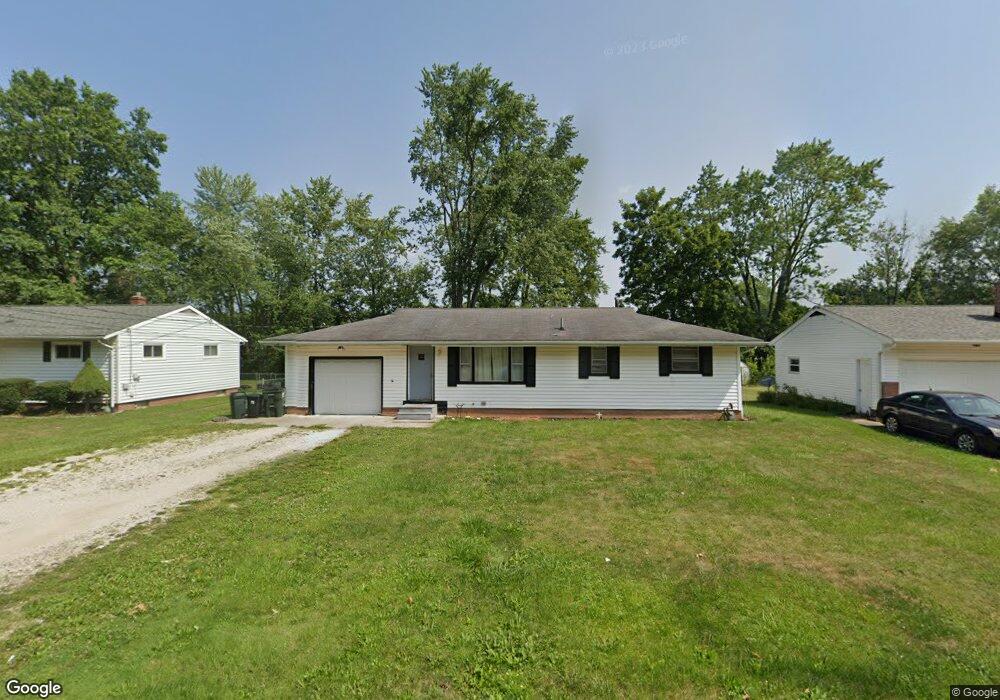
353 33rd St SW Canton, OH 44706
Estimated Value: $139,000 - $191,000
3
Beds
2
Baths
1,040
Sq Ft
$156/Sq Ft
Est. Value
About This Home
This home is located at 353 33rd St SW, Canton, OH 44706 and is currently estimated at $162,095, approximately $155 per square foot. 353 33rd St SW is a home located in Stark County with nearby schools including Faircrest Memorial Elementary School, Canton South High School, and Beacon Academy.
Ownership History
Date
Name
Owned For
Owner Type
Purchase Details
Closed on
Aug 22, 2017
Sold by
Bunyan Theresa
Bought by
Ferry William R and Thomas Stephanie Ann
Current Estimated Value
Home Financials for this Owner
Home Financials are based on the most recent Mortgage that was taken out on this home.
Original Mortgage
$62,250
Outstanding Balance
$42,892
Interest Rate
4.03%
Mortgage Type
New Conventional
Estimated Equity
$119,203
Purchase Details
Closed on
Nov 8, 2016
Bought by
Theresa Bunyan
Home Financials for this Owner
Home Financials are based on the most recent Mortgage that was taken out on this home.
Interest Rate
3.54%
Purchase Details
Closed on
Oct 25, 2006
Sold by
Nicoletti Ralph M and Nicoletti Jean H
Bought by
Nicoletti Ralph M and Nicoletti Jean H
Create a Home Valuation Report for This Property
The Home Valuation Report is an in-depth analysis detailing your home's value as well as a comparison with similar homes in the area
Purchase History
| Date | Buyer | Sale Price | Title Company |
|---|---|---|---|
| Ferry William R | $83,000 | Mk Land Title Inc | |
| Theresa Bunyan | -- | -- | |
| Nicoletti Ralph M | -- | None Available |
Source: Public Records
Mortgage History
| Date | Status | Borrower | Loan Amount |
|---|---|---|---|
| Open | Ferry William R | $62,250 | |
| Previous Owner | Theresa Bunyan | -- |
Source: Public Records
Tax History
| Year | Tax Paid | Tax Assessment Tax Assessment Total Assessment is a certain percentage of the fair market value that is determined by local assessors to be the total taxable value of land and additions on the property. | Land | Improvement |
|---|---|---|---|---|
| 2025 | -- | $36,820 | $12,180 | $24,640 |
| 2024 | -- | $36,820 | $12,180 | $24,640 |
| 2023 | $1,834 | $31,710 | $8,190 | $23,520 |
| 2022 | $687 | $31,710 | $8,190 | $23,520 |
| 2021 | $1,727 | $31,710 | $8,190 | $23,520 |
| 2020 | $1,334 | $26,810 | $6,930 | $19,880 |
| 2019 | $1,356 | $26,810 | $6,930 | $19,880 |
Source: Public Records
Map
Nearby Homes
- 337 33rd St SW
- 260 Ironwood St SW
- 330 34th St SW
- 3673 Highview Ave SW
- 3211 Dueber Ave SW
- 611 Mill St SE
- 2103 Henry Ave SW
- 4847 Ashmont Ave SW
- 1721 Hammond Ave SW
- 4858 Ashmont Ave SW
- 0 20th St SW
- 1700 Clark Ave SW
- 0 49th St SW Unit 5185153
- 0 49th St SW Unit 5185124
- 1529 Stark Ave SW
- 1889 Faircrest St SE
- 0 Birchmont Ave SW Unit 5185117
- 2022 Tanner Ave SW
- 5213 Ridge Ave SE
- 5247 Birchmont Ave SW
- 345 33rd St SW
- 363 33rd St SW
- 250 Ironwood St SW
- 266 Ironwood St SW
- 352 33rd St SW
- 240 Ironwood St SW
- 344 33rd St SW
- 329 33rd St SW
- 366 33rd St SW
- 3255 Forestdale Ave SW
- 701 Peerless Cir SW
- 336 33rd St SW
- 232 Ironwood St SW
- 702 Peerless Cir SW
- 328 33rd St SW
- 323 33rd St SW
- 3245 Forestdale Ave SW
- 224 Ironwood St SW
- 224 Ironwood St SW
- 3315 Forestdale Ave SW
Your Personal Tour Guide
Ask me questions while you tour the home.