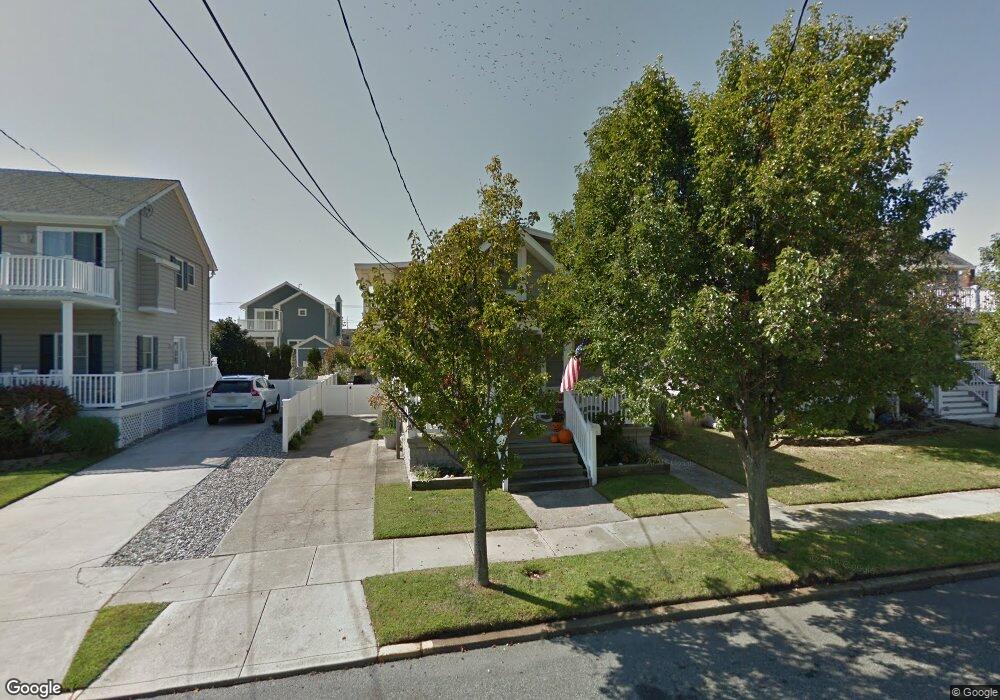
353 93rd St Stone Harbor, NJ 08247
Estimated Value: $2,467,470 - $2,917,000
Studio
--
Bath
1,928
Sq Ft
$1,367/Sq Ft
Est. Value
About This Home
This home is located at 353 93rd St, Stone Harbor, NJ 08247 and is currently estimated at $2,635,490, approximately $1,366 per square foot. 353 93rd St is a home located in Cape May County with nearby schools including Stone Harbor Elementary School.
Ownership History
Date
Name
Owned For
Owner Type
Purchase Details
Closed on
Jul 26, 2013
Sold by
Lukacs Mary M
Bought by
Lakose Jonathan and La Kose Monika
Current Estimated Value
Home Financials for this Owner
Home Financials are based on the most recent Mortgage that was taken out on this home.
Original Mortgage
$620,000
Outstanding Balance
$452,854
Interest Rate
3.95%
Mortgage Type
New Conventional
Estimated Equity
$2,182,636
Purchase Details
Closed on
Oct 3, 2005
Sold by
Lukacs Martin A and Lukacs Mary M
Bought by
Lukacs Mary M
Purchase Details
Closed on
Jun 13, 2003
Sold by
Willett Susan F
Bought by
Lukacs Martin A and Lukacs Mary M
Home Financials for this Owner
Home Financials are based on the most recent Mortgage that was taken out on this home.
Original Mortgage
$400,000
Interest Rate
5.46%
Purchase Details
Closed on
Apr 2, 1992
Sold by
Crey Ann F
Bought by
Corey,Ann Trustee Corey Family Tr
Create a Home Valuation Report for This Property
The Home Valuation Report is an in-depth analysis detailing your home's value as well as a comparison with similar homes in the area
Home Values in the Area
Average Home Value in this Area
Purchase History
| Date | Buyer | Sale Price | Title Company |
|---|---|---|---|
| Lakose Jonathan | $775,000 | None Available | |
| Lukacs Mary M | -- | -- | |
| Lukacs Martin A | $600,000 | -- | |
| Corey,Ann Trustee Corey Family Tr | -- | -- |
Source: Public Records
Mortgage History
| Date | Status | Borrower | Loan Amount |
|---|---|---|---|
| Open | Lakose Jonathan | $620,000 | |
| Previous Owner | Lukacs Martin A | $400,000 |
Source: Public Records
Tax History
| Year | Tax Paid | Tax Assessment Tax Assessment Total Assessment is a certain percentage of the fair market value that is determined by local assessors to be the total taxable value of land and additions on the property. | Land | Improvement |
|---|---|---|---|---|
| 2025 | $6,021 | $805,000 | $668,900 | $136,100 |
| 2024 | $6,021 | $805,000 | $668,900 | $136,100 |
| 2023 | $5,917 | $805,000 | $668,900 | $136,100 |
| 2022 | $5,571 | $805,000 | $668,900 | $136,100 |
| 2021 | $3,868 | $805,000 | $668,900 | $136,100 |
| 2020 | $4,911 | $805,000 | $668,900 | $136,100 |
| 2019 | $4,613 | $805,000 | $668,900 | $136,100 |
| 2018 | $4,444 | $805,000 | $668,900 | $136,100 |
| 2017 | $4,053 | $730,200 | $582,400 | $147,800 |
| 2016 | $3,907 | $730,200 | $582,400 | $147,800 |
| 2015 | $3,834 | $730,200 | $582,400 | $147,800 |
| 2014 | $3,782 | $730,200 | $582,400 | $147,800 |
Source: Public Records
Map
Nearby Homes
- 9301 3rd Ave Unit 2A
- 9301 3rd Ave Unit 1A
- 9301 3rd Ave Unit 2B
- 9301 3rd Ave Unit 2C
- 9102 3rd Ave
- 9501 Sunset Dr Unit 7
- 9501 Sunset Dr Unit 6
- 9511 Sunset Dr Unit 401
- 9214 2nd Ave
- 164 93rd St
- 440 98th St
- 252 89th St Unit E/S
- 100 96th St Unit 304
- 259 99th St
- 243 87th St
- 9835 Sunset Dr
- 144 89th St
- 13 93rd St Unit 5
- 154 98th St
- 10 92nd St Unit A
Your Personal Tour Guide
Ask me questions while you tour the home.