353 Boyd Rd Rutledge, AL 36071
Estimated Value: $206,040 - $213,000
Studio
--
Bath
2,258
Sq Ft
$93/Sq Ft
Est. Value
About This Home
This home is located at 353 Boyd Rd, Rutledge, AL 36071 and is currently estimated at $210,347, approximately $93 per square foot. 353 Boyd Rd is a home located in Crenshaw County.
Ownership History
Date
Name
Owned For
Owner Type
Purchase Details
Closed on
Mar 19, 2010
Sold by
Bees Leslie Glenn and Bees Dorothy
Bought by
Bees Jim
Current Estimated Value
Create a Home Valuation Report for This Property
The Home Valuation Report is an in-depth analysis detailing your home's value as well as a comparison with similar homes in the area
Purchase History
| Date | Buyer | Sale Price | Title Company |
|---|---|---|---|
| Bees Jim | -- | -- |
Source: Public Records
Tax History
| Year | Tax Paid | Tax Assessment Tax Assessment Total Assessment is a certain percentage of the fair market value that is determined by local assessors to be the total taxable value of land and additions on the property. | Land | Improvement |
|---|---|---|---|---|
| 2024 | $582 | $17,940 | $4,020 | $13,920 |
| 2023 | $516 | $15,400 | $3,420 | $11,980 |
| 2022 | $437 | $13,320 | $2,860 | $10,460 |
| 2021 | $337 | $10,680 | $2,720 | $7,960 |
| 2020 | $337 | $10,680 | $2,720 | $7,960 |
| 2019 | $329 | $10,480 | $2,660 | $7,820 |
| 2018 | $272 | $9,900 | $2,020 | $7,880 |
| 2017 | $280 | $9,180 | $2,020 | $7,160 |
| 2016 | $280 | $9,180 | $2,020 | $7,160 |
| 2015 | $280 | $9,180 | $2,020 | $7,160 |
| 2014 | $301 | $9,180 | $2,020 | $7,160 |
| 2013 | $301 | $9,740 | $2,020 | $7,720 |
Source: Public Records
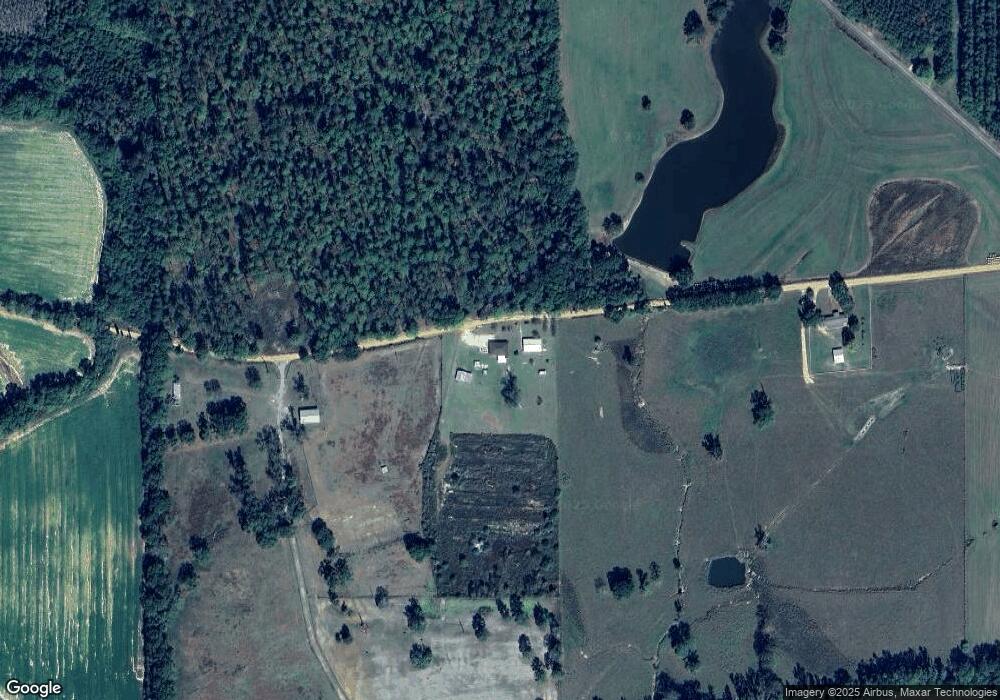
Map
Nearby Homes
- Smyth Rd
- 864 Black Rock Church Rd
- 7818 Greenville Hwy
- 0 Cook Stand Rd
- 1309 County Line Church Rd
- 5962 Greenville Hwy
- 7818 Greenville Hwy
- 0 Cook Stand Rd
- 5899 Greenville Hwy
- 0 Cedar Cut Rd Unit 26048
- 4700 Greenville Hwy
- 258 Ponderosa Rd
- 4228 Center Ridge Rd
- 3547 Dock Rd
- 0 Greenville Hwy
- Hicks Rd
- 3613 Quail Tower Rd
- 0 Canterbury Rd
- 1869 Lee St
- 5292 Ivy Creek Rd
- 185 Boyd Rd
- 3114 Chapel Hill Rd
- 2911 Chapel Hill Rd
- 1459 Hickory Grove Rd
- 305 Jeffcoat Rd
- 285 Jeffcoat Rd
- 881 Hickory Grove Rd
- 1688 Hickory Grove Rd
- 223 Jeffcoat Rd
- 271 Jeffcoat Rd
- 749 Hickory Grove Rd
- 1649 Hickory Grove Rd
- 171 Jeffcoat Rd
- 372 Jeffcoat Rd
- 223 Jeffcoat St
- 332 Jeffcoat Rd
- 655 Hickory Grove Rd
- 1085 N Moodys Crossroads Rd
Your Personal Tour Guide
Ask me questions while you tour the home.