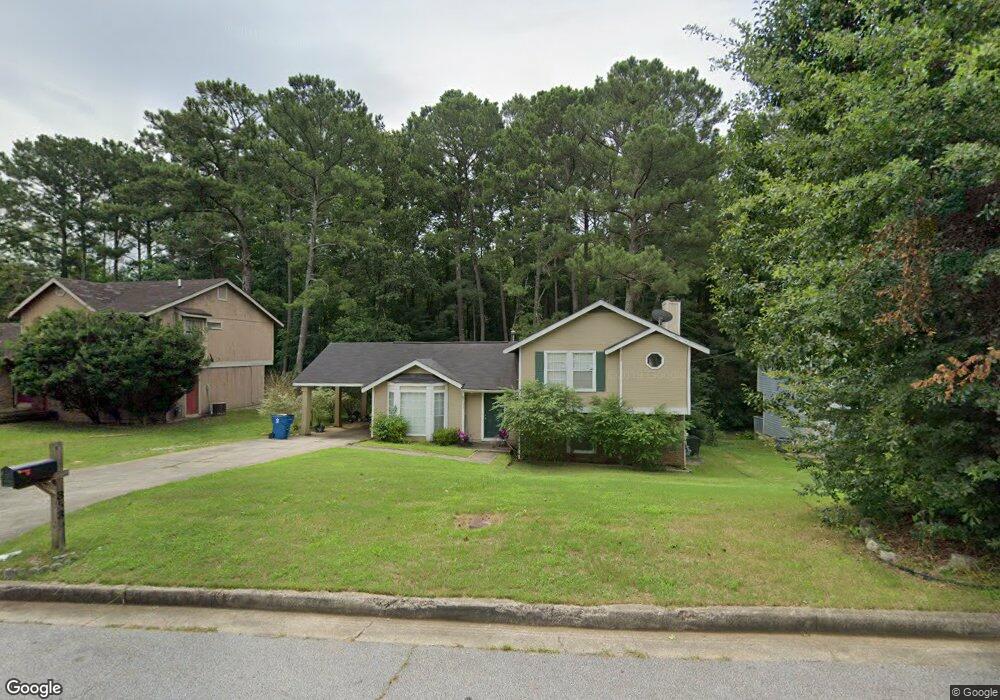
353 Brittan Trail Jonesboro, GA 30236
Estimated Value: $207,000 - $220,000
3
Beds
3
Baths
1,192
Sq Ft
$178/Sq Ft
Est. Value
About This Home
This home is located at 353 Brittan Trail, Jonesboro, GA 30236 and is currently estimated at $212,140, approximately $177 per square foot. 353 Brittan Trail is a home located in Clayton County with nearby schools including Callaway Elementary School, Kendrick Middle School, and Riverdale High School.
Ownership History
Date
Name
Owned For
Owner Type
Purchase Details
Closed on
Oct 2, 2015
Sold by
Mnsf Ii Acquisitions Llc
Bought by
Mnsf Ii T1 Llc
Current Estimated Value
Purchase Details
Closed on
May 22, 2015
Sold by
Deanna Frank Llc
Bought by
Mnsf Ii Acquisitions Llc
Purchase Details
Closed on
Jan 9, 2014
Sold by
Willowdale Investments Llc
Bought by
Deanna Frank Llc
Purchase Details
Closed on
Nov 5, 2013
Sold by
Shannon Herbert A
Bought by
Willowdale Ivestments Llc
Purchase Details
Closed on
Apr 30, 2004
Sold by
Ferguson Linda B
Bought by
Shannon Herbert A
Home Financials for this Owner
Home Financials are based on the most recent Mortgage that was taken out on this home.
Original Mortgage
$117,080
Interest Rate
5.36%
Mortgage Type
VA
Purchase Details
Closed on
Aug 5, 1994
Sold by
Bonilla Soto Victor M
Bought by
Ferguson Linda B
Home Financials for this Owner
Home Financials are based on the most recent Mortgage that was taken out on this home.
Original Mortgage
$72,250
Interest Rate
8.53%
Mortgage Type
FHA
Create a Home Valuation Report for This Property
The Home Valuation Report is an in-depth analysis detailing your home's value as well as a comparison with similar homes in the area
Home Values in the Area
Average Home Value in this Area
Purchase History
| Date | Buyer | Sale Price | Title Company |
|---|---|---|---|
| Mnsf Ii T1 Llc | $108,000 | -- | |
| Mnsf Ii Acquisitions Llc | $67,000 | -- | |
| Deanna Frank Llc | $46,000 | -- | |
| Willowdale Ivestments Llc | $35,600 | -- | |
| Shannon Herbert A | $118,500 | -- | |
| Ferguson Linda B | $73,900 | -- |
Source: Public Records
Mortgage History
| Date | Status | Borrower | Loan Amount |
|---|---|---|---|
| Previous Owner | Shannon Herbert A | $117,080 | |
| Previous Owner | Ferguson Linda B | $72,250 |
Source: Public Records
Tax History Compared to Growth
Tax History
| Year | Tax Paid | Tax Assessment Tax Assessment Total Assessment is a certain percentage of the fair market value that is determined by local assessors to be the total taxable value of land and additions on the property. | Land | Improvement |
|---|---|---|---|---|
| 2024 | $3,613 | $91,720 | $7,200 | $84,520 |
| 2023 | $3,019 | $82,640 | $7,200 | $75,440 |
| 2022 | $1,793 | $44,800 | $7,200 | $37,600 |
| 2021 | $1,804 | $44,800 | $7,200 | $37,600 |
| 2020 | $1,827 | $44,800 | $7,200 | $37,600 |
| 2019 | $1,624 | $39,138 | $5,600 | $33,538 |
| 2018 | $1,413 | $33,946 | $5,600 | $28,346 |
| 2017 | $1,154 | $27,510 | $5,600 | $21,910 |
| 2016 | $1,249 | $29,830 | $5,600 | $24,230 |
| 2015 | $771 | $0 | $0 | $0 |
| 2014 | $601 | $14,240 | $5,600 | $8,640 |
Source: Public Records
Map
Nearby Homes
- 371 Chase Woods Cir
- 353 Brittan Trail
- 7582 Smith Ct
- 182 Iris Ct
- 198 Lexington Ct Unit 3
- 194 Lexington Ct
- 7755 Chase Woods Dr
- 7677 Tara Blvd #34 Blvd
- 7807 Park Ln
- 7804 Chase Woods Dr
- 583 Fielding Cir
- 543 Wavelyn Way
- 7677 Tara Blvd Unit E34
- 7845 Chase Woods Dr
- 418 Cameo Dr Unit 2
- 96 Sedgefield Dr
- 7371 Ovis Ct
- 7673 Cloverdale Ln
- 7428 Mockingbird Trail
- 80 Rountree Rd
- 345 Brittan Trail
- 361 Brittan Trail
- 0 Brittan Trail Unit 7150679
- 0 Brittan Trail Unit 7012366
- 0 Brittan Trail Unit 8093914
- 0 Brittan Trail Unit 7479026
- 0 Brittan Trail Unit 7012421
- 0 Brittan Trail Unit 8868275
- 0 Brittan Trail Unit 8908580
- 0 Brittan Trail Unit 2830294
- 0 Brittan Trail Unit 3261284
- 0 Brittan Trail Unit 7187861
- 0 Brittan Trail Unit 7230089
- 0 Brittan Trail
- 337 Brittan Trail
- 337 Brittan Trail Unit 52
- 369 Brittan Trail
- 369 Brittan Trail Unit 48
- 352 Brittan Trail
- 360 Brittan Trail