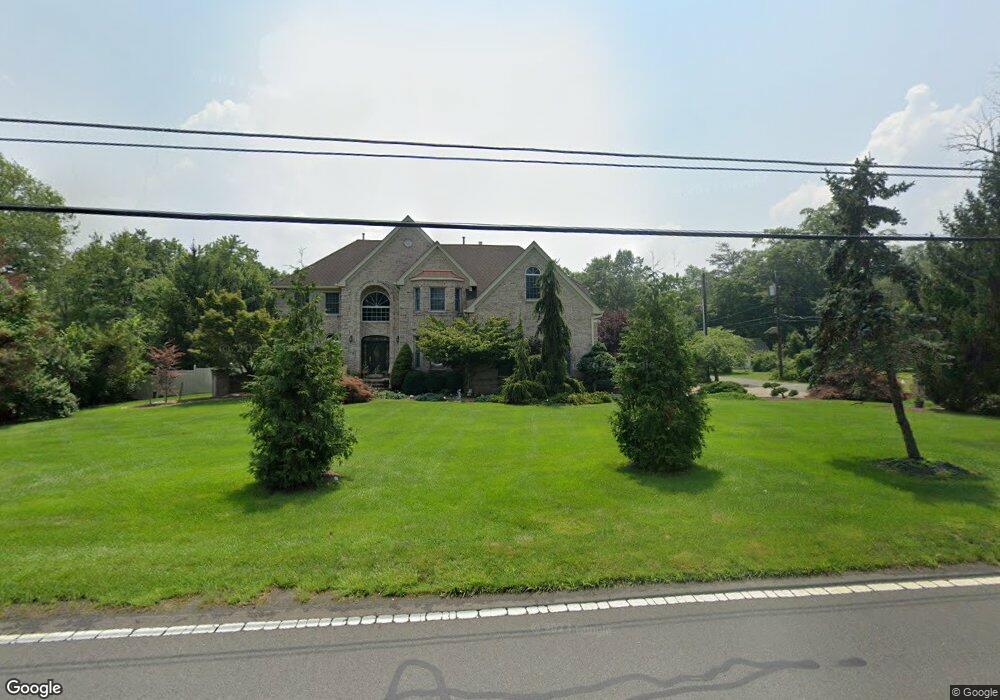
353 Bunker Hill Rd Princeton, NJ 08540
Estimated Value: $1,246,000 - $1,526,000
4
Beds
5
Baths
5,417
Sq Ft
$261/Sq Ft
Est. Value
About This Home
This home is located at 353 Bunker Hill Rd, Princeton, NJ 08540 and is currently estimated at $1,411,557, approximately $260 per square foot. 353 Bunker Hill Rd is a home located in Somerset County with nearby schools including Franklin High School, Guidepost Montessori at Kendall Park, and St. Augustine of Canterbury School.
Ownership History
Date
Name
Owned For
Owner Type
Purchase Details
Closed on
Sep 3, 2020
Sold by
Altomonte Santoro
Bought by
Donatti Evandro C and Louzada Donatti Lailiane
Current Estimated Value
Home Financials for this Owner
Home Financials are based on the most recent Mortgage that was taken out on this home.
Original Mortgage
$520,000
Outstanding Balance
$371,893
Interest Rate
3%
Mortgage Type
New Conventional
Estimated Equity
$1,039,664
Purchase Details
Closed on
Aug 20, 2020
Sold by
Altomonte Santoro
Bought by
Donatti Evandro C and Louzada-Donatti Lailiane C
Home Financials for this Owner
Home Financials are based on the most recent Mortgage that was taken out on this home.
Original Mortgage
$520,000
Outstanding Balance
$371,893
Interest Rate
3%
Mortgage Type
New Conventional
Estimated Equity
$1,039,664
Purchase Details
Closed on
Oct 25, 2001
Sold by
Ruben Richard
Bought by
Santoro Altomonte and Altomonte Bonnie
Purchase Details
Closed on
Mar 27, 2001
Sold by
Mtg Access
Bought by
Rubin Richard
Purchase Details
Closed on
Jan 21, 1993
Sold by
Larue Ricky L and Larue Donna D
Bought by
Larue Ricky L
Create a Home Valuation Report for This Property
The Home Valuation Report is an in-depth analysis detailing your home's value as well as a comparison with similar homes in the area
Home Values in the Area
Average Home Value in this Area
Purchase History
| Date | Buyer | Sale Price | Title Company |
|---|---|---|---|
| Donatti Evandro C | $900,000 | Westcor Land Title Ins Co | |
| Donatti Evandro C | $900,000 | Land Title Services | |
| Santoro Altomonte | $85,000 | -- | |
| Rubin Richard | $75,000 | -- | |
| Larue Ricky L | -- | -- |
Source: Public Records
Mortgage History
| Date | Status | Borrower | Loan Amount |
|---|---|---|---|
| Open | Donatti Evandro C | $520,000 | |
| Closed | Donatti Evandro C | $520,000 |
Source: Public Records
Tax History Compared to Growth
Tax History
| Year | Tax Paid | Tax Assessment Tax Assessment Total Assessment is a certain percentage of the fair market value that is determined by local assessors to be the total taxable value of land and additions on the property. | Land | Improvement |
|---|---|---|---|---|
| 2025 | $18,811 | $1,362,200 | $322,900 | $1,039,300 |
| 2024 | $18,811 | $1,043,300 | $322,900 | $720,400 |
| 2023 | $19,322 | $1,005,300 | $284,900 | $720,400 |
| 2022 | $18,944 | $934,100 | $213,700 | $720,400 |
| 2021 | $18,777 | $896,100 | $175,700 | $720,400 |
| 2020 | $20,028 | $886,600 | $166,200 | $720,400 |
| 2019 | $20,277 | $886,600 | $166,200 | $720,400 |
| 2018 | $20,480 | $886,600 | $166,200 | $720,400 |
| 2017 | $20,757 | $895,100 | $174,700 | $720,400 |
| 2016 | $20,936 | $895,100 | $174,700 | $720,400 |
| 2015 | $18,967 | $816,500 | $175,700 | $640,800 |
| 2014 | $18,620 | $813,800 | $174,700 | $639,100 |
Source: Public Records
Map
Nearby Homes
- 351 Bunker Hill Rd
- 34 Leiv Eirikson Ave
- 30 Leiv Eirikson Ave
- 41 Washington Ave
- 45 Washington Ave
- 26 Leiv Eirikson Ave
- 343 Bunker Hill Rd
- 35 Washington Ave
- 373 Bunker Hill Rd
- 33 Washington Ave
- 22 Leiv Eirikson Ave
- 348 Bunker Hill Rd
- 21 Leiv Eirikson Ave
- 31 Washington Ave
- 348 Bunker Hill Rd
- 20 Leiv Eirikson Ave
- 336 Bunker Hill Rd
- 30 Washington Ave
- 17 Leiv Eirikson Ave
- 18 Leiv Eirikson Ave