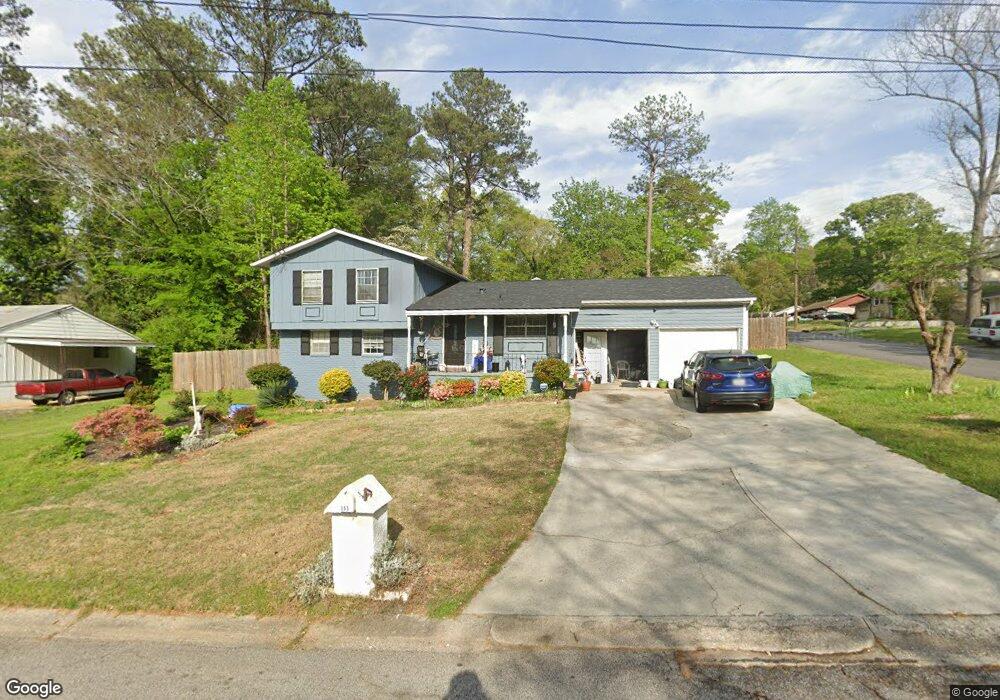
353 Camelot Pkwy Jonesboro, GA 30236
Estimated Value: $167,000 - $218,000
3
Beds
2
Baths
1,969
Sq Ft
$100/Sq Ft
Est. Value
About This Home
This home is located at 353 Camelot Pkwy, Jonesboro, GA 30236 and is currently estimated at $196,628, approximately $99 per square foot. 353 Camelot Pkwy is a home located in Clayton County with nearby schools including Kilpatrick Elementary School, Sequoyah Middle School, and Charles R. Drew High School.
Ownership History
Date
Name
Owned For
Owner Type
Purchase Details
Closed on
Jun 29, 2021
Sold by
Clarke Kiva Viola
Bought by
Clarke Kiva Viola and Clarke Jefferey Elliott
Current Estimated Value
Purchase Details
Closed on
Feb 3, 2017
Sold by
Tran Huong
Bought by
Clarke Kiva Viola
Home Financials for this Owner
Home Financials are based on the most recent Mortgage that was taken out on this home.
Original Mortgage
$65,000
Interest Rate
4.2%
Mortgage Type
New Conventional
Purchase Details
Closed on
Jun 10, 2009
Sold by
Hud-Housing Of Urban Dev
Bought by
Tran Huong
Purchase Details
Closed on
Feb 3, 2009
Sold by
Wells Fargo Bank Na
Bought by
Hud-Housing Of Urban Dev
Purchase Details
Closed on
Oct 29, 2003
Sold by
Hamby Jerry C and Hamby Joy M
Bought by
Neave Ana M
Home Financials for this Owner
Home Financials are based on the most recent Mortgage that was taken out on this home.
Original Mortgage
$114,207
Interest Rate
6%
Mortgage Type
FHA
Create a Home Valuation Report for This Property
The Home Valuation Report is an in-depth analysis detailing your home's value as well as a comparison with similar homes in the area
Home Values in the Area
Average Home Value in this Area
Purchase History
| Date | Buyer | Sale Price | Title Company |
|---|---|---|---|
| Clarke Kiva Viola | -- | -- | |
| Clarke Kiva Viola | $70,000 | -- | |
| Tran Huong | -- | -- | |
| Hud-Housing Of Urban Dev | -- | -- | |
| Wells Fargo Bank Na | $114,088 | -- | |
| Neave Ana M | $116,800 | -- |
Source: Public Records
Mortgage History
| Date | Status | Borrower | Loan Amount |
|---|---|---|---|
| Previous Owner | Clarke Kiva Viola | $65,000 | |
| Previous Owner | Neave Ana M | $114,207 |
Source: Public Records
Tax History Compared to Growth
Tax History
| Year | Tax Paid | Tax Assessment Tax Assessment Total Assessment is a certain percentage of the fair market value that is determined by local assessors to be the total taxable value of land and additions on the property. | Land | Improvement |
|---|---|---|---|---|
| 2025 | $2,275 | $68,480 | $6,400 | $62,080 |
| 2024 | $2,054 | $61,760 | $6,400 | $55,360 |
| 2023 | $1,228 | $61,040 | $6,400 | $54,640 |
| 2022 | $1,644 | $51,000 | $6,400 | $44,600 |
| 2021 | $1,234 | $40,360 | $6,400 | $33,960 |
| 2020 | $937 | $32,551 | $6,400 | $26,151 |
| 2019 | $729 | $27,102 | $3,200 | $23,902 |
| 2018 | $1,016 | $24,174 | $3,200 | $20,974 |
| 2017 | $747 | $17,488 | $3,200 | $14,288 |
| 2016 | $769 | $18,034 | $3,200 | $14,834 |
| 2015 | $766 | $0 | $0 | $0 |
| 2014 | $624 | $14,815 | $3,200 | $11,615 |
Source: Public Records
Map
Nearby Homes
- 367 Camelot Pkwy
- 446 Queen Aliese Ln
- 474 Autumn Dr
- 7114 Lady Heidi Ct
- 7118 Lady Heidi Ct
- 285 Queen Helen Ln
- 7428 Mockingbird Trail
- 7348 Mockingbird Trail
- 213 Whipporwill Way
- 7390 Ovis Ln
- 112 Rivercrest Dr
- 3938 Alderwoods Dr
- 9404 Maple Dr Unit 292
- 9398 Maple Dr
- 3942 Alderwoods Dr
- 3943 Alderwoods Dr
- 9398 Maple Grove Ln Unit 39
- 9404 Maple Grove Ln Unit 42
- 9404 Maple Grove Ln
- 9439 Maple Grove Ln Unit LOT 268
- 357 Camelot Pkwy
- 394 Queen Aliese Ln
- 389 Queen Aliese Ln Unit 1
- 381 Queen Aliese Ln
- 354 Camelot Pkwy
- 400 Queen Aliese Ln Unit I
- 373 Queen Aliese Ln
- 395 Queen Aliese Ln Unit 1
- 358 Camelot Pkwy Unit 1
- 391 Camelot Pkwy
- 365 Queen Aliese Ln
- 401 Queen Aliese Ln Unit 1
- 362 Camelot Pkwy
- 401 Camelot Pkwy
- 483 King Arthur Ct
- 357 Queen Aliese Ln Unit 1
- 402 Autumn Dr
- 409 Queen Aliese Ln
- 396 Autumn Dr
- 479 King Arthur Ct