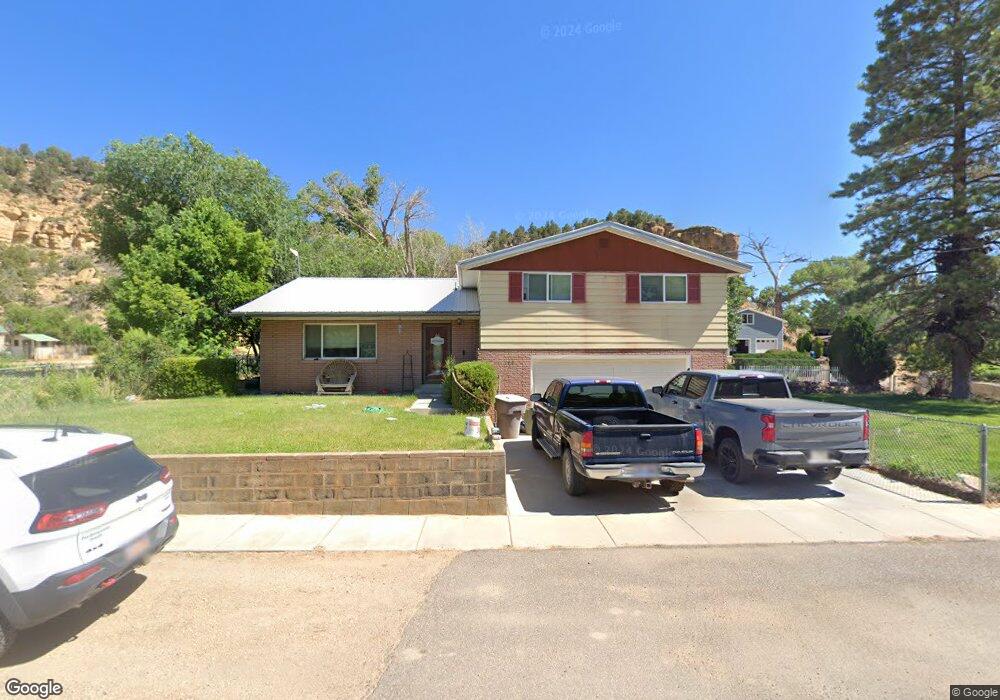
353 E 100 North St N Orderville, UT 84758
Estimated Value: $245,000 - $315,000
--
Bed
1
Bath
1,642
Sq Ft
$175/Sq Ft
Est. Value
About This Home
This home is located at 353 E 100 North St N, Orderville, UT 84758 and is currently estimated at $287,814, approximately $175 per square foot. 353 E 100 North St N is a home with nearby schools including Valley Elementary School and Valley High School.
Ownership History
Date
Name
Owned For
Owner Type
Purchase Details
Closed on
May 3, 2022
Sold by
Adair Jacqueline G
Bought by
Shay Lamb W and Lamb Shaelyn N
Current Estimated Value
Create a Home Valuation Report for This Property
The Home Valuation Report is an in-depth analysis detailing your home's value as well as a comparison with similar homes in the area
Home Values in the Area
Average Home Value in this Area
Purchase History
| Date | Buyer | Sale Price | Title Company |
|---|---|---|---|
| Shay Lamb W | -- | -- |
Source: Public Records
Tax History Compared to Growth
Tax History
| Year | Tax Paid | Tax Assessment Tax Assessment Total Assessment is a certain percentage of the fair market value that is determined by local assessors to be the total taxable value of land and additions on the property. | Land | Improvement |
|---|---|---|---|---|
| 2025 | $1,021 | $120,274 | $21,785 | $98,489 |
| 2024 | $1,021 | $121,870 | $20,747 | $101,123 |
| 2023 | $899 | $111,689 | $19,759 | $91,930 |
| 2022 | $886 | $97,003 | $20,735 | $76,268 |
| 2021 | $835 | $135,669 | $29,000 | $106,669 |
| 2020 | $857 | $135,669 | $29,000 | $106,669 |
| 2019 | $792 | $121,572 | $29,000 | $92,572 |
| 2018 | $797 | $121,572 | $29,000 | $92,572 |
| 2017 | $853 | $127,650 | $29,000 | $98,650 |
| 2016 | $874 | $127,650 | $29,000 | $98,650 |
| 2015 | $800 | $127,650 | $29,000 | $98,650 |
| 2014 | $800 | $115,790 | $29,000 | $86,790 |
| 2013 | -- | $63,685 | $0 | $0 |
Source: Public Records
Map
Nearby Homes
- 65 E 200 S
- 0 W Pinyon Pine Dr Unit 1409030
- 0 W White Cliffs Dr Unit 1408846
- 0 W Squawberry Cir
- 95 E 100 N
- 342 E Overlook Ln
- 0 Bench Rd
- 325 N Main St
- 0 Hwy 89 Unit 1408986
- 1460 E Coral Pink Cliffs Rd
- 240 Acres In Glendale
- 1 Caruso Ln Unit 1
- 35 Prickley Pear Pinyon Pine Dr Unit 35
- 6 Caruso Ln Unit 6
- 12 Block "C" St Unit 8A-C12
- 12 Mountain View Dr Unit 12
- 5 Caruso Ln Unit 5
- 2 Caruso Ln Unit 2
- 255 White Oak St S Unit D24 25
- 3 Caruso Ln Unit 1
- 371 E 100 St N
- 325 E 100 St N
- 385 E 100 St N
- 290 E 100 St N
- 299 E 100 St N
- 285 E 100 St N
- 274 E 100 St N
- E100N419 E E 100 N N
- 271 E 100 St N
- 331 E State St
- 321 E State St
- 260 E 100 St N
- 390 E E 150 N N
- 251 E 100 St N
- 236 E 100 St N
- 311 E State St
- 231 E 100 St N
- 299 E State St
- 210 E 100 St N
- 310 E State St