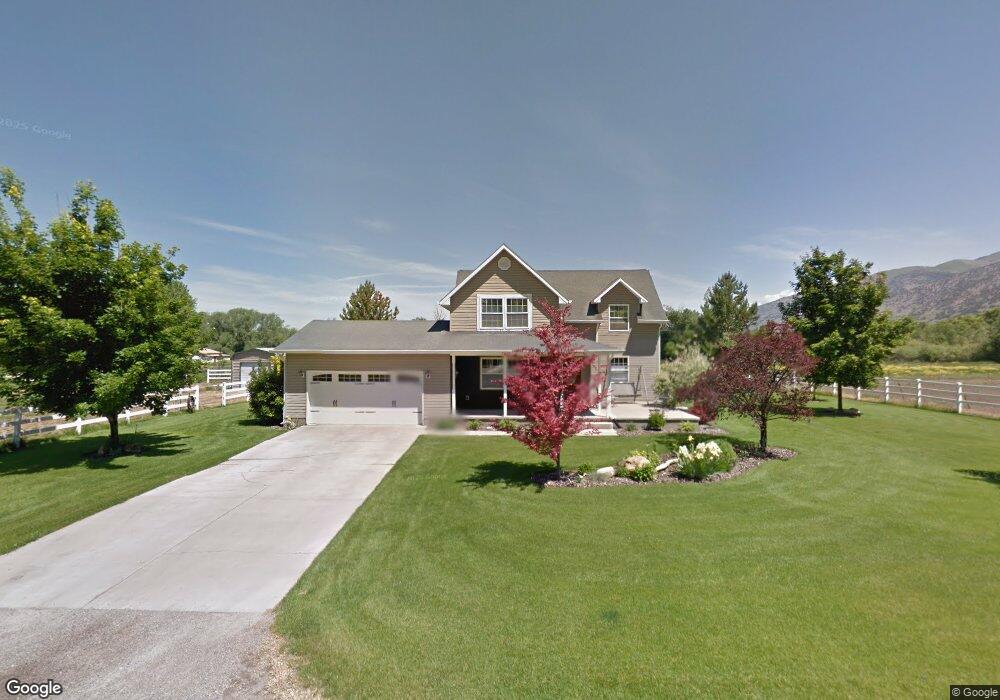
353 E 4300 S Nibley, UT 84321
Estimated Value: $597,000 - $766,000
4
Beds
3
Baths
1,981
Sq Ft
$351/Sq Ft
Est. Value
About This Home
This home is located at 353 E 4300 S, Nibley, UT 84321 and is currently estimated at $696,209, approximately $351 per square foot. 353 E 4300 S is a home located in Cache County with nearby schools including Heritage School, South Cache Middle School, and Spring Creek Middle School.
Ownership History
Date
Name
Owned For
Owner Type
Purchase Details
Closed on
Nov 14, 2018
Sold by
Rounds Gayla
Bought by
Rounds Gayla W and Gayla W Rounds Revocable Trust
Current Estimated Value
Purchase Details
Closed on
Aug 13, 2018
Sold by
Barfuss Gary L and Barfuss Pamela
Bought by
Rounds Gayla
Purchase Details
Closed on
Feb 13, 2017
Sold by
Barfuss Gary L
Bought by
Barfuss Gary L and Barfuss Pamela
Create a Home Valuation Report for This Property
The Home Valuation Report is an in-depth analysis detailing your home's value as well as a comparison with similar homes in the area
Home Values in the Area
Average Home Value in this Area
Purchase History
| Date | Buyer | Sale Price | Title Company |
|---|---|---|---|
| Rounds Gayla W | -- | None Available | |
| Rounds Gayla | -- | Pinnacle Title | |
| Barfuss Gary L | -- | Title Source Inc |
Source: Public Records
Tax History
| Year | Tax Paid | Tax Assessment Tax Assessment Total Assessment is a certain percentage of the fair market value that is determined by local assessors to be the total taxable value of land and additions on the property. | Land | Improvement |
|---|---|---|---|---|
| 2025 | $2,939 | $389,520 | $0 | $0 |
| 2023 | $2,617 | $304,970 | $0 | $0 |
| 2022 | $2,724 | $304,975 | $0 | $0 |
| 2021 | $2,875 | $438,505 | $220,000 | $218,505 |
| 2020 | $2,752 | $394,100 | $220,000 | $174,100 |
| 2019 | $2,736 | $370,408 | $220,000 | $150,408 |
| 2018 | $2,207 | $290,790 | $160,000 | $130,790 |
| 2017 | $2,212 | $180,395 | $0 | $0 |
| 2016 | $2,236 | $180,395 | $0 | $0 |
| 2015 | $1,908 | $154,920 | $0 | $0 |
| 2014 | $1,865 | $154,920 | $0 | $0 |
| 2013 | -- | $164,345 | $0 | $0 |
Source: Public Records
Map
Nearby Homes
- 4009 S Cottonwoods Ct
- 5025 S Hollow Rd Unit 44
- 5025 S Hollow Rd Unit 45
- 5025 S Hollow Rd Unit 47
- 5025 S Hollow Rd
- 732 E 730 N
- 698 E 730 N
- 645 N 600 E
- 271 W 2975 S Unit 725
- 271 W 2975 S
- 3923 Hillside Dr
- 440 N 600 E
- 355 Scenic View Dr
- 864 E 250 N
- 862 E 250 N
- 860 E 250 N
- 858 E 250 N
- 856 E 250 N
- 762 Anderson Ave
- 396 W 3650 S
Your Personal Tour Guide
Ask me questions while you tour the home.