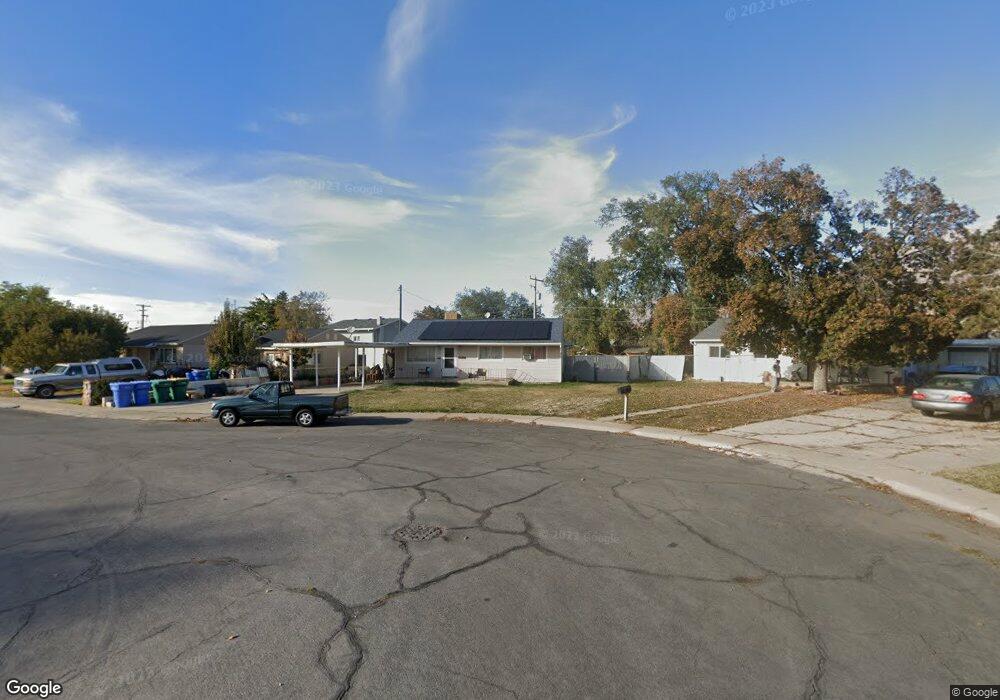
353 E 750 N Vineyard, UT 84057
Estimated Value: $463,000 - $478,373
4
Beds
3
Baths
2,248
Sq Ft
$210/Sq Ft
Est. Value
About This Home
This home is located at 353 E 750 N, Vineyard, UT 84057 and is currently estimated at $471,093, approximately $209 per square foot. 353 E 750 N is a home located in Utah County with nearby schools including Orem Junior High School, Mountain View High School, and Franklin Discovery Academy.
Ownership History
Date
Name
Owned For
Owner Type
Purchase Details
Closed on
Oct 1, 2025
Sold by
Winget Collin and Winget Alicia
Bought by
Kt Bullock Family Trust and Bullock
Current Estimated Value
Home Financials for this Owner
Home Financials are based on the most recent Mortgage that was taken out on this home.
Original Mortgage
$369,600
Outstanding Balance
$369,600
Interest Rate
6.58%
Mortgage Type
New Conventional
Estimated Equity
$101,493
Purchase Details
Closed on
Jun 22, 2023
Sold by
Corunum Llc
Bought by
Winget Collin and Winget Alicia
Home Financials for this Owner
Home Financials are based on the most recent Mortgage that was taken out on this home.
Original Mortgage
$356,250
Interest Rate
6.35%
Mortgage Type
New Conventional
Purchase Details
Closed on
Jun 16, 2021
Sold by
Tace Llc
Bought by
Corunum Llc
Purchase Details
Closed on
Jan 31, 2020
Sold by
Ep1lh Llc
Bought by
Tace Llc
Create a Home Valuation Report for This Property
The Home Valuation Report is an in-depth analysis detailing your home's value as well as a comparison with similar homes in the area
Home Values in the Area
Average Home Value in this Area
Purchase History
| Date | Buyer | Sale Price | Title Company |
|---|---|---|---|
| Kt Bullock Family Trust | -- | Eagle Gate Title | |
| Winget Collin | -- | Investors Title | |
| Corunum Llc | -- | Invictus Title | |
| Tace Llc | -- | Invictus Title |
Source: Public Records
Mortgage History
| Date | Status | Borrower | Loan Amount |
|---|---|---|---|
| Open | Kt Bullock Family Trust | $369,600 | |
| Previous Owner | Winget Collin | $356,250 |
Source: Public Records
Tax History
| Year | Tax Paid | Tax Assessment Tax Assessment Total Assessment is a certain percentage of the fair market value that is determined by local assessors to be the total taxable value of land and additions on the property. | Land | Improvement |
|---|---|---|---|---|
| 2025 | $2,676 | $245,795 | -- | -- |
| 2024 | $2,676 | $251,075 | $0 | $0 |
| 2023 | $2,207 | $231,330 | $0 | $0 |
| 2022 | $2,268 | $231,055 | $0 | $0 |
| 2021 | $1,988 | $310,600 | $46,600 | $264,000 |
| 2020 | $1,887 | $294,500 | $44,200 | $250,300 |
| 2019 | $1,225 | $197,000 | $40,000 | $157,000 |
| 2018 | $185 | $8,250 | $0 | $0 |
Source: Public Records
Map
Nearby Homes
- 266 N 725 E
- 280 N 750 E
- 341 N 680 E
- 206 N 750 E
- 624 E 300 N Unit 3
- 266 N 590 E Unit Building 6
- 266 N 590 E Unit 6
- 283 N 590 E
- 212 N 590 E
- 78 N Scarlet Maple Dr Unit 4304
- 235 N 590 E
- 56 N Rue de Matth
- 422 E 360 North St
- 24 W Stillwater St S Unit 153
- 1225 W 160 N
- 579 N 290 E
- 222 N 1200 W Unit 144
- 222 N 1200 W Unit 53
- 222 N 1200 W Unit 84
- 1094 W 465 N
Your Personal Tour Guide
Ask me questions while you tour the home.