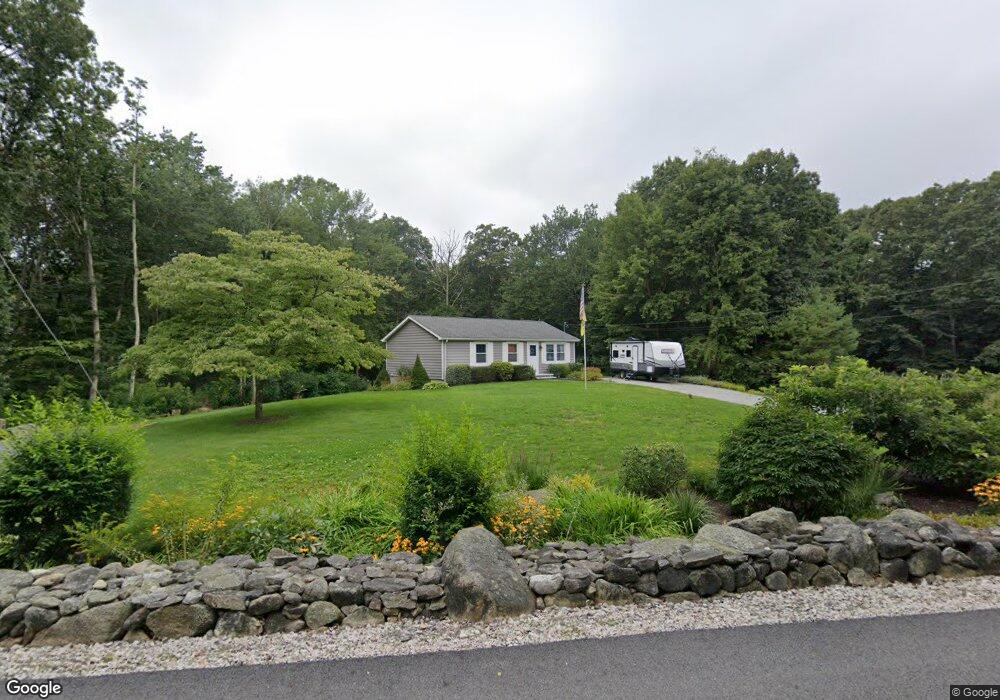
353 East St Uxbridge, MA 01569
Estimated Value: $441,408 - $508,000
3
Beds
1
Bath
960
Sq Ft
$508/Sq Ft
Est. Value
About This Home
This home is located at 353 East St, Uxbridge, MA 01569 and is currently estimated at $487,602, approximately $507 per square foot. 353 East St is a home located in Worcester County with nearby schools including Uxbridge High School.
Ownership History
Date
Name
Owned For
Owner Type
Purchase Details
Closed on
Jan 18, 1991
Sold by
Taylor John A
Bought by
Pasquino James A and Judith Pasquino
Current Estimated Value
Home Financials for this Owner
Home Financials are based on the most recent Mortgage that was taken out on this home.
Original Mortgage
$106,350
Interest Rate
9.68%
Mortgage Type
Purchase Money Mortgage
Create a Home Valuation Report for This Property
The Home Valuation Report is an in-depth analysis detailing your home's value as well as a comparison with similar homes in the area
Home Values in the Area
Average Home Value in this Area
Purchase History
| Date | Buyer | Sale Price | Title Company |
|---|---|---|---|
| Pasquino James A | $109,900 | -- | |
| Taylor John A | $30,000 | -- |
Source: Public Records
Mortgage History
| Date | Status | Borrower | Loan Amount |
|---|---|---|---|
| Open | Taylor John A | $100,000 | |
| Closed | Taylor John A | $105,778 | |
| Closed | Taylor John A | $106,350 |
Source: Public Records
Tax History Compared to Growth
Tax History
| Year | Tax Paid | Tax Assessment Tax Assessment Total Assessment is a certain percentage of the fair market value that is determined by local assessors to be the total taxable value of land and additions on the property. | Land | Improvement |
|---|---|---|---|---|
| 2025 | $49 | $370,000 | $157,800 | $212,200 |
| 2024 | $4,430 | $342,900 | $150,000 | $192,900 |
| 2023 | $4,044 | $289,900 | $129,400 | $160,500 |
| 2022 | $3,893 | $256,800 | $113,700 | $143,100 |
| 2021 | $4,025 | $254,400 | $111,300 | $143,100 |
| 2020 | $4,024 | $240,400 | $109,800 | $130,600 |
| 2019 | $4,126 | $237,800 | $109,800 | $128,000 |
| 2018 | $3,904 | $227,400 | $109,800 | $117,600 |
| 2017 | $3,421 | $201,700 | $107,500 | $94,200 |
| 2016 | $3,549 | $202,000 | $98,800 | $103,200 |
| 2015 | $3,478 | $199,900 | $98,800 | $101,100 |
Source: Public Records
Map
Nearby Homes
- 57 Kempton Rd
- 119 Albee Rd
- 23 Rifleman Way
- 127 Old Millville Rd
- 85 East St
- 12 Hickory Rd
- 90 Chestnut Hill Rd
- 70 Hill St
- 69 Adj Hill St
- 77 Chestnut Hill Rd
- 179 Thayer St
- 286 Blackstone St
- 346 Millville Rd
- 160 Thayer St
- 53 Asylum St
- 328 Millville Rd
- 24 Lincoln St
- 16 Preston St
- 129 Quaker Hwy Unit 6
- 40 Union St
- 0 Kempton Rd Unit 71726728
- 0 Kempton Rd Unit 72818780
- 0 Kempton Rd Unit 72613374
- 0 Kempton Rd Unit 72516671
- 343 East St
- 4 Kempton Rd
- 350 East St
- 361 East St
- 5 Kempton Rd
- 360 East St
- 340 East St
- LOT 4 Kempton Rd
- LOT 5 Kempton Rd
- 10 Kempton Rd
- 333 East St
- 373 East St
- 370 East St
- 323 East St
- 20 Kempton Rd
- 385 East St