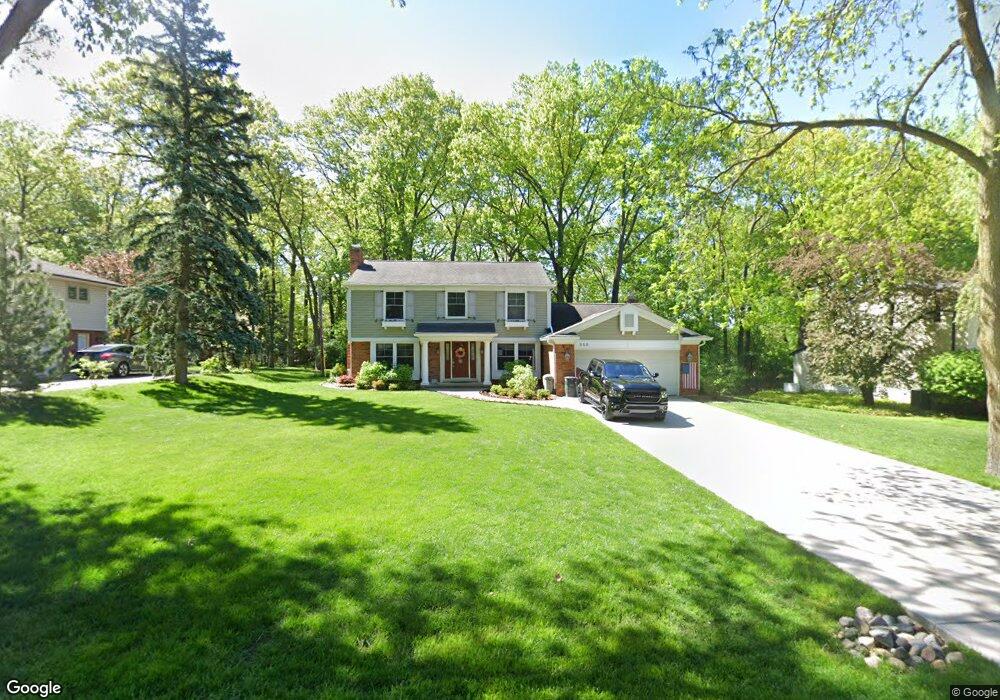
353 Eileen Dr Bloomfield Hills, MI 48302
Estimated Value: $505,684 - $617,000
4
Beds
3
Baths
2,389
Sq Ft
$243/Sq Ft
Est. Value
About This Home
This home is located at 353 Eileen Dr, Bloomfield Hills, MI 48302 and is currently estimated at $579,921, approximately $242 per square foot. 353 Eileen Dr is a home located in Oakland County with nearby schools including Way Elementary School, South Hills Middle School, and Bloomfield Hills High School.
Ownership History
Date
Name
Owned For
Owner Type
Purchase Details
Closed on
Feb 11, 2022
Sold by
Braidwood Daniel J and Braidwood Jaimee A
Bought by
Braidwood Daniel J and Braidwood Jaimee A
Current Estimated Value
Purchase Details
Closed on
Aug 19, 2016
Sold by
Braidwood Daniel J and Braidwood Jaimee A
Bought by
Braidwood Daniel J and Braidwood Jaimee A
Home Financials for this Owner
Home Financials are based on the most recent Mortgage that was taken out on this home.
Original Mortgage
$211,550
Interest Rate
3.42%
Mortgage Type
New Conventional
Purchase Details
Closed on
Jun 22, 2010
Sold by
Bartley Jason and Bartley Shannon
Bought by
Braidwood Daniel and Talampas Jaimee
Purchase Details
Closed on
Oct 10, 2002
Sold by
Reyes Marcelo M and Reyes Marietta
Bought by
Bartley Jason D
Create a Home Valuation Report for This Property
The Home Valuation Report is an in-depth analysis detailing your home's value as well as a comparison with similar homes in the area
Home Values in the Area
Average Home Value in this Area
Purchase History
| Date | Buyer | Sale Price | Title Company |
|---|---|---|---|
| Braidwood Daniel J | -- | Land Title | |
| Braidwood Daniel J | -- | None Available | |
| Braidwood Daniel | $231,000 | Capital Title Ins Agency | |
| Bartley Jason D | $235,000 | Capital Title Ins Agency |
Source: Public Records
Mortgage History
| Date | Status | Borrower | Loan Amount |
|---|---|---|---|
| Previous Owner | Braidwood Daniel J | $211,550 |
Source: Public Records
Tax History
| Year | Tax Paid | Tax Assessment Tax Assessment Total Assessment is a certain percentage of the fair market value that is determined by local assessors to be the total taxable value of land and additions on the property. | Land | Improvement |
|---|---|---|---|---|
| 2025 | $5,655 | $242,310 | $44,140 | $198,170 |
| 2024 | $2,849 | $242,310 | $0 | $0 |
| 2023 | $2,757 | $227,680 | $0 | $0 |
| 2022 | $5,182 | $191,410 | $0 | $0 |
| 2021 | $5,145 | $177,700 | $0 | $0 |
| 2020 | $2,522 | $174,040 | $0 | $0 |
| 2019 | $4,841 | $178,260 | $0 | $0 |
| 2018 | $4,863 | $176,960 | $0 | $0 |
| 2017 | $4,784 | $173,070 | $0 | $0 |
| 2016 | $4,794 | $154,730 | $0 | $0 |
| 2015 | -- | $142,710 | $0 | $0 |
| 2014 | -- | $130,230 | $0 | $0 |
| 2011 | -- | $115,410 | $0 | $0 |
Source: Public Records
Map
Nearby Homes
- 366 Sycamore Ct
- 360 Wilshire Dr
- 2835 Aspen Ln
- 350 Fremont St
- 2863 Meadowood Ln
- 2871 Meadowood Ln
- 00 S Berkshire
- 2851 Franklin Rd
- 486 Fildew Ave
- 0000 Devon Rd
- 1085 Frankel Ln
- 3060 Chickering Ln
- 200 Cedardale Ave
- 256-2 Cedardale Ave
- 256 Cedardale Ave
- 1661 Winthrop Rd
- 3080 Chickering Ct
- 503 Bloomfield Ave
- 508 Ditmar & 505 Luther
- 187 Nebraska Ave
Your Personal Tour Guide
Ask me questions while you tour the home.