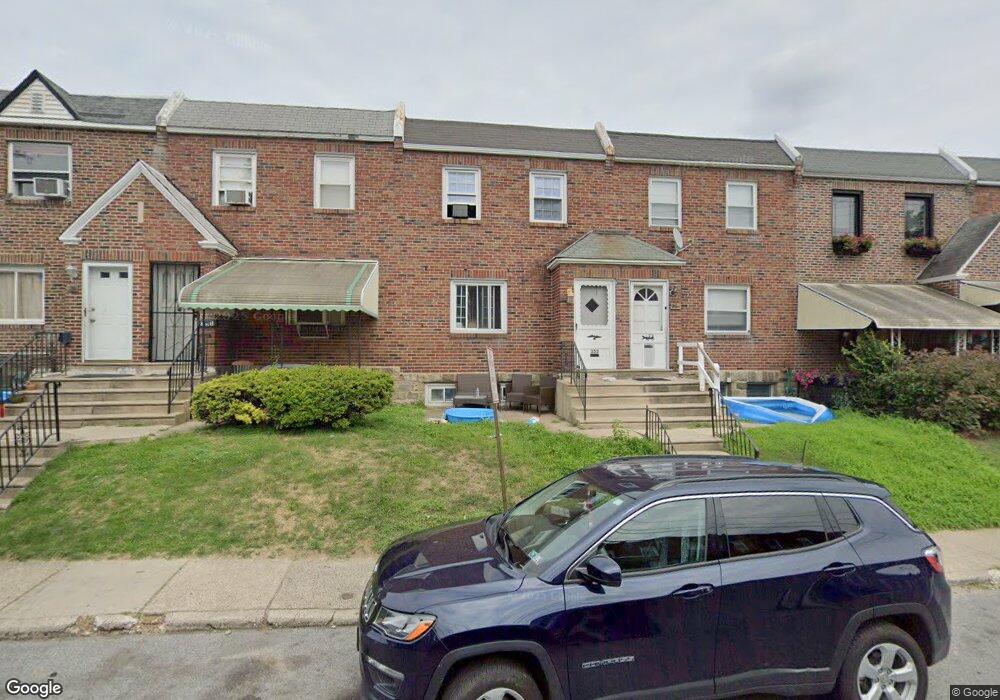
353 Hampden Rd Upper Darby, PA 19082
Estimated Value: $156,000 - $206,000
3
Beds
1
Bath
1,296
Sq Ft
$138/Sq Ft
Est. Value
About This Home
This home is located at 353 Hampden Rd, Upper Darby, PA 19082 and is currently estimated at $179,386, approximately $138 per square foot. 353 Hampden Rd is a home located in Delaware County with nearby schools including Bywood Elementary School, Upper Darby Kdg Center, and Upper Darby High School.
Ownership History
Date
Name
Owned For
Owner Type
Purchase Details
Closed on
May 25, 2023
Sold by
Pitts Richard Lee
Bought by
S & K Khans Property Llc
Current Estimated Value
Purchase Details
Closed on
Dec 16, 2005
Sold by
Fakiyesi Olutope
Bought by
Pitts Ii Richard Lee and Pitts Elizabeth Vernon
Home Financials for this Owner
Home Financials are based on the most recent Mortgage that was taken out on this home.
Original Mortgage
$20,000
Interest Rate
6.39%
Mortgage Type
Unknown
Purchase Details
Closed on
Nov 8, 2002
Sold by
Hendrick Patricia L
Bought by
Fakiyesi Olutope
Home Financials for this Owner
Home Financials are based on the most recent Mortgage that was taken out on this home.
Original Mortgage
$38,700
Interest Rate
6.03%
Mortgage Type
Purchase Money Mortgage
Create a Home Valuation Report for This Property
The Home Valuation Report is an in-depth analysis detailing your home's value as well as a comparison with similar homes in the area
Home Values in the Area
Average Home Value in this Area
Purchase History
| Date | Buyer | Sale Price | Title Company |
|---|---|---|---|
| S & K Khans Property Llc | $60,000 | None Listed On Document | |
| Pitts Ii Richard Lee | $100,000 | None Available | |
| Fakiyesi Olutope | $43,000 | T A Title Insurance Company |
Source: Public Records
Mortgage History
| Date | Status | Borrower | Loan Amount |
|---|---|---|---|
| Previous Owner | Pitts Ii Richard Lee | $20,000 | |
| Previous Owner | Pitts Ii Richard Lee | $80,000 | |
| Previous Owner | Fakiyesi Olutope | $38,700 |
Source: Public Records
Tax History Compared to Growth
Tax History
| Year | Tax Paid | Tax Assessment Tax Assessment Total Assessment is a certain percentage of the fair market value that is determined by local assessors to be the total taxable value of land and additions on the property. | Land | Improvement |
|---|---|---|---|---|
| 2025 | $3,471 | $82,070 | $21,950 | $60,120 |
| 2024 | $3,471 | $82,070 | $21,950 | $60,120 |
| 2023 | $3,438 | $82,070 | $21,950 | $60,120 |
| 2022 | $3,346 | $82,070 | $21,950 | $60,120 |
| 2021 | $4,511 | $82,070 | $21,950 | $60,120 |
| 2020 | $3,656 | $56,520 | $17,070 | $39,450 |
| 2019 | $3,592 | $56,520 | $17,070 | $39,450 |
| 2018 | $3,551 | $56,520 | $0 | $0 |
| 2017 | $3,458 | $56,520 | $0 | $0 |
| 2016 | $310 | $56,520 | $0 | $0 |
| 2015 | $310 | $56,520 | $0 | $0 |
| 2014 | $310 | $56,520 | $0 | $0 |
Source: Public Records
Map
Nearby Homes