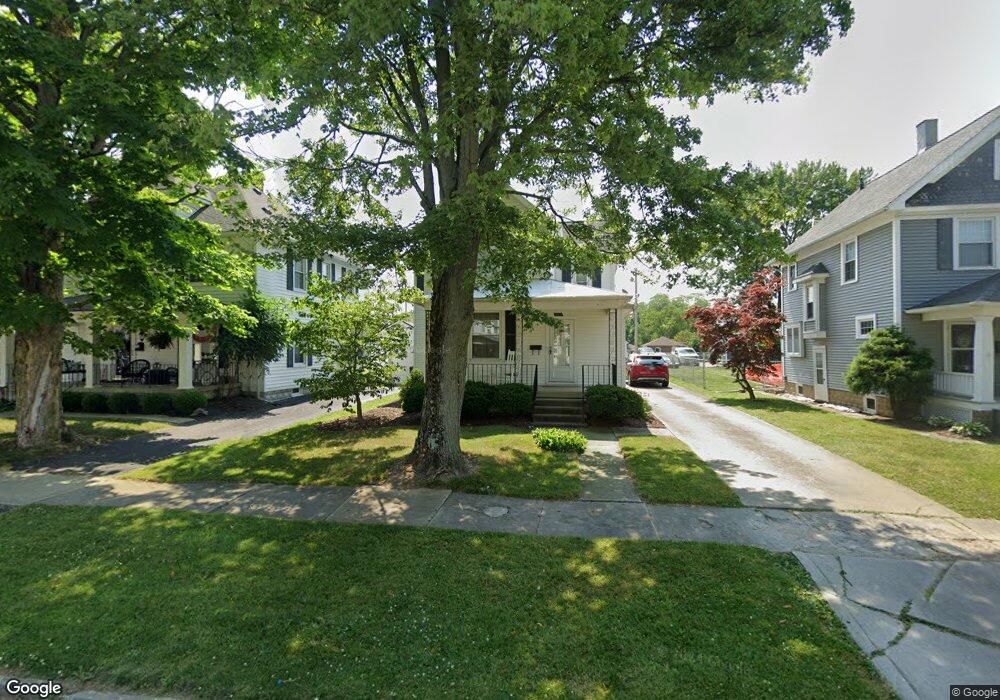
353 Hedges St Tiffin, OH 44883
Estimated Value: $176,165 - $199,000
3
Beds
2
Baths
1,848
Sq Ft
$102/Sq Ft
Est. Value
About This Home
This home is located at 353 Hedges St, Tiffin, OH 44883 and is currently estimated at $187,791, approximately $101 per square foot. 353 Hedges St is a home located in Seneca County with nearby schools including Columbian High School, Bridges Community Academy, and Calvert High School.
Ownership History
Date
Name
Owned For
Owner Type
Purchase Details
Closed on
Aug 30, 2011
Sold by
Gregg Virginia R
Bought by
Devore Brandi L
Current Estimated Value
Home Financials for this Owner
Home Financials are based on the most recent Mortgage that was taken out on this home.
Original Mortgage
$69,600
Outstanding Balance
$47,110
Interest Rate
4.4%
Mortgage Type
New Conventional
Estimated Equity
$140,681
Purchase Details
Closed on
Apr 25, 2008
Sold by
Turco Caroline L and Smith Caroline L
Bought by
Gregg Virginia R
Home Financials for this Owner
Home Financials are based on the most recent Mortgage that was taken out on this home.
Original Mortgage
$84,000
Interest Rate
5.88%
Mortgage Type
New Conventional
Create a Home Valuation Report for This Property
The Home Valuation Report is an in-depth analysis detailing your home's value as well as a comparison with similar homes in the area
Home Values in the Area
Average Home Value in this Area
Purchase History
| Date | Buyer | Sale Price | Title Company |
|---|---|---|---|
| Devore Brandi L | $87,000 | Assured Title | |
| Gregg Virginia R | $105,000 | None Available |
Source: Public Records
Mortgage History
| Date | Status | Borrower | Loan Amount |
|---|---|---|---|
| Open | Devore Brandi L | $69,600 | |
| Previous Owner | Gregg Virginia R | $84,000 |
Source: Public Records
Tax History
| Year | Tax Paid | Tax Assessment Tax Assessment Total Assessment is a certain percentage of the fair market value that is determined by local assessors to be the total taxable value of land and additions on the property. | Land | Improvement |
|---|---|---|---|---|
| 2025 | $1,679 | $49,510 | $5,350 | $44,160 |
| 2024 | $1,672 | $49,510 | $5,350 | $44,160 |
| 2023 | $1,674 | $49,510 | $5,350 | $44,160 |
| 2022 | $1,613 | $39,580 | $5,040 | $34,540 |
| 2021 | $1,624 | $39,580 | $5,040 | $34,540 |
| 2020 | $1,655 | $39,575 | $5,037 | $34,538 |
| 2019 | $1,475 | $34,129 | $4,459 | $29,670 |
| 2018 | $1,478 | $34,129 | $4,459 | $29,670 |
| 2017 | $1,494 | $34,129 | $4,459 | $29,670 |
| 2016 | $1,299 | $30,450 | $4,459 | $25,991 |
| 2015 | $1,284 | $30,450 | $4,459 | $25,991 |
| 2014 | $1,210 | $30,450 | $4,459 | $25,991 |
| 2013 | $1,255 | $30,450 | $4,459 | $25,991 |
Source: Public Records
Map
Nearby Homes
Your Personal Tour Guide
Ask me questions while you tour the home.