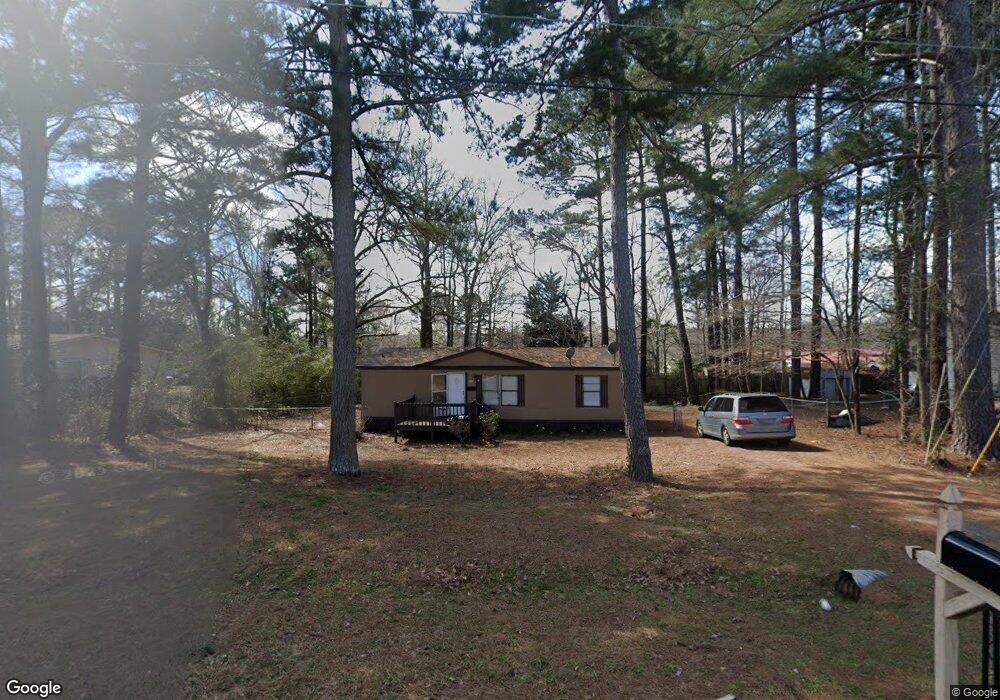
353 Hemlock Ln Locust Grove, GA 30248
Estimated Value: $88,000 - $130,439
3
Beds
2
Baths
920
Sq Ft
$118/Sq Ft
Est. Value
About This Home
This home is located at 353 Hemlock Ln, Locust Grove, GA 30248 and is currently estimated at $108,480, approximately $117 per square foot. 353 Hemlock Ln is a home located in Henry County with nearby schools including Unity Grove Elementary School, Locust Grove Middle School, and Locust Grove High School.
Ownership History
Date
Name
Owned For
Owner Type
Purchase Details
Closed on
May 16, 2016
Sold by
Secretary Of Housing And Urban Developme
Bought by
Limra Properties Llc
Current Estimated Value
Purchase Details
Closed on
Jul 3, 2012
Sold by
Morris Edna
Bought by
Bank Of America Na
Purchase Details
Closed on
Feb 25, 2002
Sold by
Leach Melody A
Bought by
Morris Edna L
Home Financials for this Owner
Home Financials are based on the most recent Mortgage that was taken out on this home.
Original Mortgage
$51,257
Interest Rate
6.81%
Mortgage Type
FHA
Purchase Details
Closed on
Jun 25, 1999
Sold by
Grubbs Charles F and Grubbs Kelly S
Bought by
Leach Melody A
Home Financials for this Owner
Home Financials are based on the most recent Mortgage that was taken out on this home.
Original Mortgage
$51,282
Interest Rate
7.23%
Mortgage Type
FHA
Create a Home Valuation Report for This Property
The Home Valuation Report is an in-depth analysis detailing your home's value as well as a comparison with similar homes in the area
Home Values in the Area
Average Home Value in this Area
Purchase History
| Date | Buyer | Sale Price | Title Company |
|---|---|---|---|
| Limra Properties Llc | $20,101 | -- | |
| Bank Of America Na | -- | -- | |
| Morris Edna L | $59,500 | -- | |
| Leach Melody A | $52,000 | -- |
Source: Public Records
Mortgage History
| Date | Status | Borrower | Loan Amount |
|---|---|---|---|
| Previous Owner | Morris Edna L | $51,257 | |
| Previous Owner | Leach Melody A | $51,282 |
Source: Public Records
Tax History Compared to Growth
Tax History
| Year | Tax Paid | Tax Assessment Tax Assessment Total Assessment is a certain percentage of the fair market value that is determined by local assessors to be the total taxable value of land and additions on the property. | Land | Improvement |
|---|---|---|---|---|
| 2025 | $1,989 | $50,520 | $11,200 | $39,320 |
| 2024 | $1,989 | $36,360 | $11,200 | $25,160 |
| 2023 | $1,087 | $29,200 | $8,000 | $21,200 |
| 2022 | $908 | $24,080 | $7,200 | $16,880 |
| 2021 | $596 | $15,400 | $6,000 | $9,400 |
| 2020 | $463 | $11,720 | $4,800 | $6,920 |
| 2019 | $386 | $9,440 | $4,800 | $4,640 |
| 2018 | $320 | $7,720 | $4,000 | $3,720 |
| 2016 | $336 | $8,160 | $2,800 | $5,360 |
| 2015 | $407 | $9,760 | $2,800 | $6,960 |
| 2014 | $362 | $8,560 | $3,200 | $5,360 |
Source: Public Records
Map
Nearby Homes
- 362 Hemlock Ln
- 361 Hemlock Ln
- 280 Lakeview Dr
- 340 Loblolly Ridge
- 322 Loblolly Ridge
- 172 Lakeview Dr
- 116 Jodi Place
- 2036 Ross Ln
- 830 Lincoln Square
- 3019 Ryan Rd
- 959 Gettysburg Way
- 3026 Ryan Rd
- 703 Paul Revere Dr
- 215 Highland Dr
- 26 Skyland Dr W
- Youngtown Plan at Copperfield
- 132 Felicity Pike
- 111 Felicity Pike
- Westin Plan at Copperfield
- 100 Felicity Pike
- 0 Hemlock Ln Unit 7556579
- 0 Hemlock Ln
- 277 Lakeview Dr
- 363 Hemlock Ln
- 276 Lakeview Dr
- 278 Lakeview Dr
- 367 Hemlock Ln
- 274 Lakeview Dr
- 255 Lakeview Dr
- 252 Lakeview Dr
- 281 Lakeview Dr
- 0 Juniper Ct
- 366 Juniper Ct
- 256 Lakeview Dr
- 329 Loblolly Ridge
- 0 Lakeview Dr Unit 7043197
- 0 Lakeview Dr Unit 3158642
- 0 Lakeview Dr Unit 3148075
- 0 Lakeview Dr Unit 3270027
- 0 Lakeview Dr Unit 8582353