353 Howards Ln Hampstead, NC 28443
Estimated Value: $897,000 - $1,682,000
2
Beds
4
Baths
1,649
Sq Ft
$795/Sq Ft
Est. Value
About This Home
This home is located at 353 Howards Ln, Hampstead, NC 28443 and is currently estimated at $1,311,140, approximately $795 per square foot. 353 Howards Ln is a home located in Pender County with nearby schools including Topsail Elementary School, Topsail Middle School, and Topsail High School.
Ownership History
Date
Name
Owned For
Owner Type
Purchase Details
Closed on
Dec 23, 1997
Bought by
Carter John E
Current Estimated Value
Create a Home Valuation Report for This Property
The Home Valuation Report is an in-depth analysis detailing your home's value as well as a comparison with similar homes in the area
Home Values in the Area
Average Home Value in this Area
Purchase History
| Date | Buyer | Sale Price | Title Company |
|---|---|---|---|
| Carter John E | $160,000 | -- |
Source: Public Records
Tax History
| Year | Tax Paid | Tax Assessment Tax Assessment Total Assessment is a certain percentage of the fair market value that is determined by local assessors to be the total taxable value of land and additions on the property. | Land | Improvement |
|---|---|---|---|---|
| 2025 | $5,788 | $1,703,547 | $1,200,225 | $503,322 |
| 2024 | $5,788 | $604,157 | $346,617 | $257,540 |
| 2023 | $5,250 | $604,157 | $346,617 | $257,540 |
| 2022 | $5,250 | $604,157 | $346,617 | $257,540 |
| 2021 | $5,250 | $604,157 | $346,617 | $257,540 |
| 2020 | $5,250 | $551,708 | $294,168 | $257,540 |
| 2019 | $4,813 | $551,708 | $294,168 | $257,540 |
| 2018 | $4,613 | $503,449 | $280,722 | $222,727 |
| 2017 | $4,613 | $503,449 | $280,722 | $222,727 |
| 2016 | $4,562 | $503,449 | $280,722 | $222,727 |
| 2015 | $4,527 | $503,449 | $280,722 | $222,727 |
| 2014 | $3,544 | $503,449 | $280,722 | $222,727 |
| 2013 | -- | $503,449 | $280,722 | $222,727 |
| 2012 | -- | $503,449 | $280,722 | $222,727 |
Source: Public Records
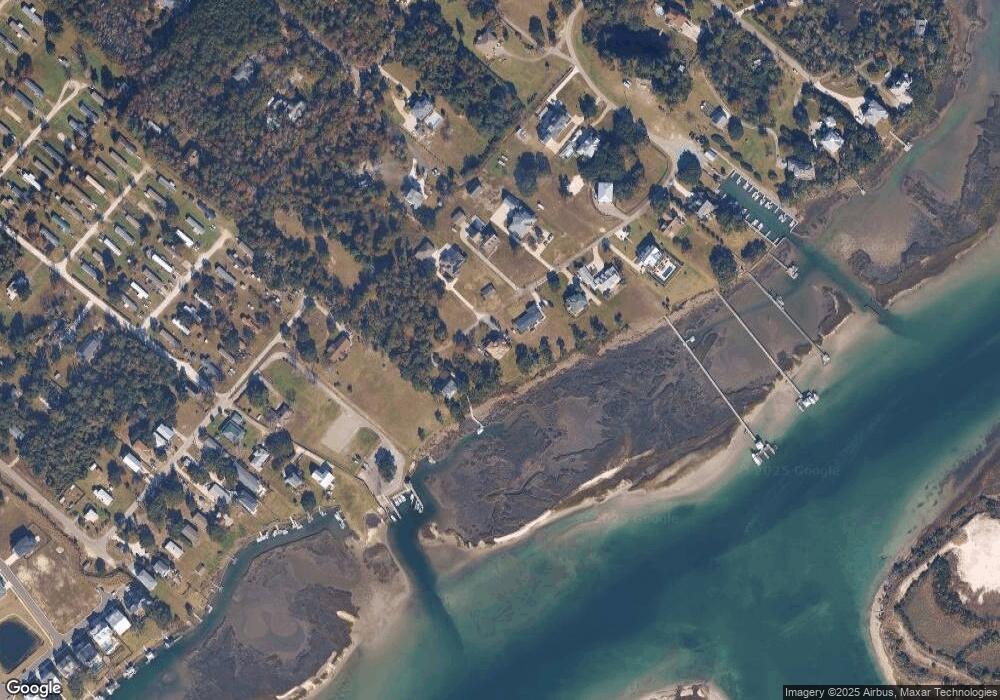
Map
Nearby Homes
- 103 Broadview Ln
- 7 Waterfront Place
- 163 Voyager Way
- 11 Amidships Ln
- 109c Corcus Ferry Rd
- 232 Shoal Ave
- 140 E Keel Dr
- 187 Tilloo Cut Way
- 378 Aster Place
- 552 Lea Dr
- 133 Tilloo Cut Way
- 145 W Keel Dr
- 107 Weir Dr
- 1091 Dan Owen Dr
- 416 Lea Dr
- 1189 Dan Owen Dr
- 197 Jackline Dr
- 601 Wildwood Rd
- 173 Mae Dr
- 126 Jackline Dr
- 309 Howards Ln
- 393 Howards Ln
- 326 Howards Ln
- 285 Howards Ln
- 300 Howards Ln
- 257 Howards Ln
- 282 Howards Ln
- Lot 15 Howards Ln
- Lot 16 Howards Ln
- Lot 11 Howards Ln
- Lot 10 Howards Ln
- 233 Howards Ln
- 16 Howards Ln
- 123 Howards Ln
- 0 Howards Ln
- Lot 3 & 3a Howards Ln
- 128 Broadview Ln
- 214 Howards Ln
- 122 Broadview Ln
- 213 Howards Ln
Your Personal Tour Guide
Ask me questions while you tour the home.