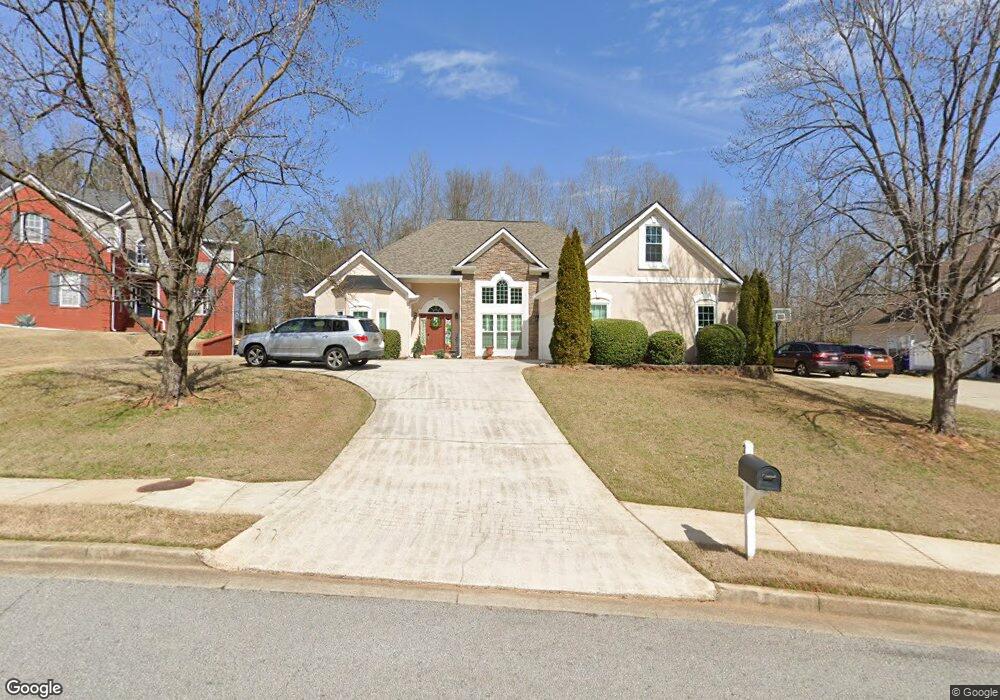
353 Inverness Ave McDonough, GA 30253
Estimated Value: $330,929 - $394,000
3
Beds
2
Baths
2,376
Sq Ft
$156/Sq Ft
Est. Value
About This Home
This home is located at 353 Inverness Ave, McDonough, GA 30253 and is currently estimated at $369,482, approximately $155 per square foot. 353 Inverness Ave is a home located in Henry County with nearby schools including Union Grove Middle School, Union Grove High School, and Hickory Flat Elementary School.
Ownership History
Date
Name
Owned For
Owner Type
Purchase Details
Closed on
May 6, 2021
Sold by
Deery Stacey E
Bought by
Laverick Stacey E and Laverick John R
Current Estimated Value
Home Financials for this Owner
Home Financials are based on the most recent Mortgage that was taken out on this home.
Original Mortgage
$235,799
Outstanding Balance
$213,238
Interest Rate
3.1%
Mortgage Type
VA
Estimated Equity
$156,244
Purchase Details
Closed on
Apr 9, 2004
Sold by
Heller Joel D
Bought by
Deery Stacey E
Home Financials for this Owner
Home Financials are based on the most recent Mortgage that was taken out on this home.
Original Mortgage
$174,700
Interest Rate
3.5%
Mortgage Type
New Conventional
Purchase Details
Closed on
May 5, 2000
Sold by
Collins Communities Inc
Bought by
Heller Joel D
Home Financials for this Owner
Home Financials are based on the most recent Mortgage that was taken out on this home.
Original Mortgage
$196,350
Interest Rate
7.38%
Mortgage Type
New Conventional
Create a Home Valuation Report for This Property
The Home Valuation Report is an in-depth analysis detailing your home's value as well as a comparison with similar homes in the area
Home Values in the Area
Average Home Value in this Area
Purchase History
| Date | Buyer | Sale Price | Title Company |
|---|---|---|---|
| Laverick Stacey E | -- | -- | |
| Deery Stacey E | $218,400 | -- | |
| Heller Joel D | $206,700 | -- |
Source: Public Records
Mortgage History
| Date | Status | Borrower | Loan Amount |
|---|---|---|---|
| Open | Laverick Stacey E | $235,799 | |
| Previous Owner | Deery Stacey E | $174,700 | |
| Previous Owner | Heller Joel D | $196,350 |
Source: Public Records
Tax History Compared to Growth
Tax History
| Year | Tax Paid | Tax Assessment Tax Assessment Total Assessment is a certain percentage of the fair market value that is determined by local assessors to be the total taxable value of land and additions on the property. | Land | Improvement |
|---|---|---|---|---|
| 2025 | $4,751 | $138,280 | $16,000 | $122,280 |
| 2024 | $4,751 | $133,240 | $16,000 | $117,240 |
| 2023 | $4,399 | $139,640 | $14,000 | $125,640 |
| 2022 | $4,029 | $118,160 | $14,000 | $104,160 |
| 2021 | $3,452 | $93,800 | $14,000 | $79,800 |
| 2020 | $3,210 | $84,160 | $12,000 | $72,160 |
| 2019 | $3,001 | $80,640 | $10,000 | $70,640 |
| 2018 | $2,854 | $76,800 | $10,000 | $66,800 |
| 2016 | $2,546 | $68,760 | $8,000 | $60,760 |
| 2015 | $2,596 | $68,400 | $8,000 | $60,400 |
| 2014 | $2,251 | $59,120 | $8,000 | $51,120 |
Source: Public Records
Map
Nearby Homes
- 321 Inverness Ave
- 441 Aviemore Loop
- 172 Summit View Dr
- 479 Sawtooth Ln
- 221 Summit View Dr
- 271 Mckinley Loop
- 113 Glenmore Ln
- 1181 Paramount Dr
- 176 Cranapple Ln
- 209 Braemar Ct
- 401 Crosshaven Way
- 466 Astoria Way
- 212 Himalaya Way
- 248 Cranapple Ln
- 146 Himalaya Way
- 236 Himalaya Way
- 152 Rockport Dr
- 153 Rockport Dr
- 733 Stonehaven Chase
- 124 Crown Walk
- 349 Inverness Ave Unit 2
- 357 Inverness Ave Unit 2
- 345 Inverness Ave Unit 2
- 360 Inverness Ave
- 361 Inverness Ave
- 341 Inverness Ave
- 356 Inverness Ave
- 368 Inverness Ave
- 364 Inverness Ave
- 364 Inverness Ave Unit 2
- 352 Inverness Ave
- 153 Glenmore Ln
- 348 Inverness Ave
- 348 Inverness Ave Unit 2
- 149 Glenmore Ln
- 344 Inverness Ave
- 344 Inverness Ave Unit 2
- 168 Glenmore Ln
- 457 Aviemore Loop
- 164 Glenmore Ln