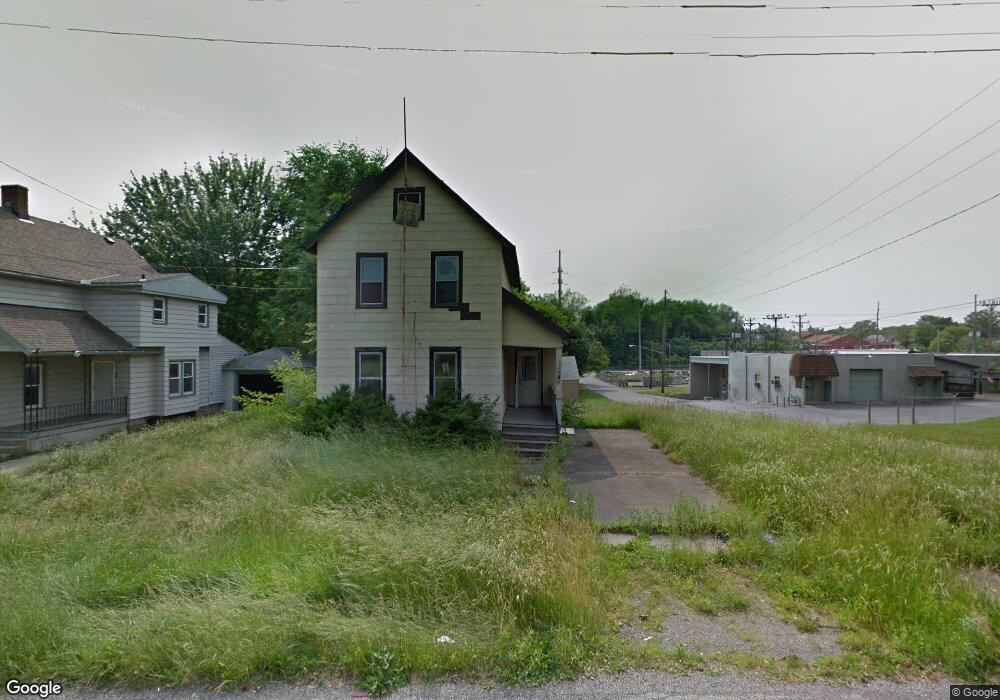
353 Logan Ave NE Warren, OH 44483
Harding NeighborhoodEstimated Value: $92,000 - $192,000
3
Beds
1
Bath
1,392
Sq Ft
$102/Sq Ft
Est. Value
About This Home
This home is located at 353 Logan Ave NE, Warren, OH 44483 and is currently estimated at $142,000, approximately $102 per square foot. 353 Logan Ave NE is a home located in Trumbull County with nearby schools including Warren G. Harding High School, Lincoln PK-8 School, and Steam Academy of Warren.
Ownership History
Date
Name
Owned For
Owner Type
Purchase Details
Closed on
Nov 28, 2023
Sold by
Trumbull County Land Reutilization Corpo
Bought by
Inspiring Minds
Current Estimated Value
Purchase Details
Closed on
Sep 30, 2015
Sold by
Curie Paul E
Bought by
Trumbull County Land Reutilization
Home Financials for this Owner
Home Financials are based on the most recent Mortgage that was taken out on this home.
Interest Rate
3.86%
Purchase Details
Closed on
Dec 9, 2009
Sold by
Secretary Of Housing & Urban Development
Bought by
Curie Paul E
Purchase Details
Closed on
Mar 20, 2002
Sold by
Mcmillion Noralee Y
Bought by
Hugley Gore Glenda
Purchase Details
Closed on
Jul 24, 2001
Sold by
Mcmillion Leanne
Bought by
Mcmillion Noralee Y
Purchase Details
Closed on
Oct 16, 2000
Sold by
Brown Ruth Alveda
Bought by
Mcmillion Noralee Y and Mcmillion Leanne
Purchase Details
Closed on
Jan 1, 1990
Bought by
Ruth Alveda Brown
Create a Home Valuation Report for This Property
The Home Valuation Report is an in-depth analysis detailing your home's value as well as a comparison with similar homes in the area
Home Values in the Area
Average Home Value in this Area
Purchase History
| Date | Buyer | Sale Price | Title Company |
|---|---|---|---|
| Inspiring Minds | -- | None Listed On Document | |
| Trumbull County Land Reutilization | -- | -- | |
| Curie Paul E | $1,000 | Lakeside Title & Escrow Agen | |
| Hugley Gore Glenda | $53,000 | -- | |
| Mcmillion Noralee Y | -- | -- | |
| Mcmillion Noralee Y | $45,000 | -- | |
| Ruth Alveda Brown | -- | -- |
Source: Public Records
Mortgage History
| Date | Status | Borrower | Loan Amount |
|---|---|---|---|
| Previous Owner | Mcmillion Noralee Y | -- |
Source: Public Records
Tax History Compared to Growth
Tax History
| Year | Tax Paid | Tax Assessment Tax Assessment Total Assessment is a certain percentage of the fair market value that is determined by local assessors to be the total taxable value of land and additions on the property. | Land | Improvement |
|---|---|---|---|---|
| 2024 | $21 | $390 | $390 | $0 |
| 2023 | $20 | $390 | $390 | $0 |
| 2022 | $25 | $390 | $390 | $0 |
| 2021 | $25 | $390 | $390 | $0 |
| 2020 | $25 | $390 | $390 | $0 |
| 2019 | $27 | $390 | $390 | $0 |
| 2018 | $27 | $390 | $390 | $0 |
| 2017 | $26 | $390 | $390 | $0 |
| 2016 | $143 | $2,210 | $2,210 | $0 |
| 2015 | $377 | $5,850 | $2,770 | $3,080 |
| 2014 | $375 | $5,850 | $2,770 | $3,080 |
| 2013 | $1,024 | $6,170 | $2,770 | $3,400 |
Source: Public Records
Map
Nearby Homes
- 265 Charles Ave NE
- 351 Laird Ave NE
- 433 Olive Ave NE Unit 435
- 151 Bonnie Brae Ave NE
- 1250 Grant St SE
- 257 Iddings Ave SE
- 442 Belmont Ave NE
- 318 Fairmount Ave NE
- 428 Waverly Ave NE
- 210 Fairmount Ave NE
- 1033 Olive Ave NE
- 356 Laird Ave SE
- 424 Kenilworth Ave NE
- 978 Hollywood St NE
- 1253 Belle St SE
- 159 Kenilworth Ave SE
- 1554 Edgewood St NE
- 1475 Hollywood St NE
- 1208 Youngstown Rd SE
- 451 Homewood Ave SE
- 341 Logan Ave NE
- 417 Logan Ave NE
- 406 Logan Ave NE
- 352 Logan Ave NE
- 330 Logan Ave NE
- 433 Logan Ave NE
- 420 Logan Ave NE
- 322 Logan Ave NE
- 439 Logan Ave NE
- 312 Logan Ave NE
- 1032 Mckinley St NE
- 434 Logan Ave NE
- 880 Woodland St NE
- 304 Logan Ave NE
- 1042 Mckinley St NE
- 1041 Mckinley St NE
- 1004 Woodland St NE
- 890 Harrison St NE
- 1052 Mckinley St NE
- 1049 Mckinley St NE