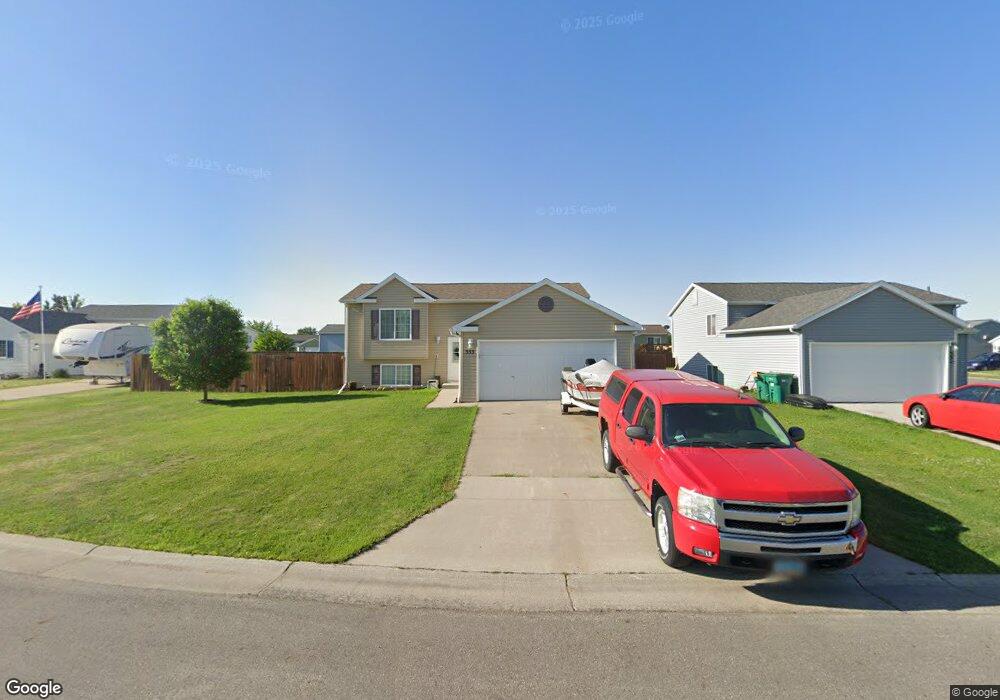
353 Maple Point Blvd Mapleton, ND 58059
Estimated Value: $259,000 - $292,000
3
Beds
2
Baths
1,616
Sq Ft
$173/Sq Ft
Est. Value
About This Home
This home is located at 353 Maple Point Blvd, Mapleton, ND 58059 and is currently estimated at $278,783, approximately $172 per square foot. 353 Maple Point Blvd is a home located in Cass County with nearby schools including Mapleton Elementary School.
Ownership History
Date
Name
Owned For
Owner Type
Purchase Details
Closed on
Jun 22, 2023
Sold by
Vick Brady and Vick Julie
Bought by
Vick Michael
Current Estimated Value
Purchase Details
Closed on
Jun 14, 2021
Sold by
Huerd Tara L
Bought by
Vick Julie and Vick Brady
Purchase Details
Closed on
Jul 14, 2016
Sold by
Wacker Craig L and Wacker Mary K
Bought by
Huerd Tara L
Home Financials for this Owner
Home Financials are based on the most recent Mortgage that was taken out on this home.
Original Mortgage
$174,579
Interest Rate
3.66%
Mortgage Type
FHA
Purchase Details
Closed on
Aug 23, 2007
Sold by
Eid-Co Buildings Inc
Bought by
Wacker Craig L and Wacker Mary K
Home Financials for this Owner
Home Financials are based on the most recent Mortgage that was taken out on this home.
Original Mortgage
$101,127
Interest Rate
6.77%
Mortgage Type
New Conventional
Create a Home Valuation Report for This Property
The Home Valuation Report is an in-depth analysis detailing your home's value as well as a comparison with similar homes in the area
Purchase History
| Date | Buyer | Sale Price | Title Company |
|---|---|---|---|
| Vick Michael | -- | None Listed On Document | |
| Vick Julie | $218,000 | The Title Co | |
| Huerd Tara L | $177,800 | None Available | |
| Wacker Craig L | -- | -- |
Source: Public Records
Mortgage History
| Date | Status | Borrower | Loan Amount |
|---|---|---|---|
| Previous Owner | Huerd Tara L | $174,579 | |
| Previous Owner | Wacker Craig L | $101,127 |
Source: Public Records
Tax History
| Year | Tax Paid | Tax Assessment Tax Assessment Total Assessment is a certain percentage of the fair market value that is determined by local assessors to be the total taxable value of land and additions on the property. | Land | Improvement |
|---|---|---|---|---|
| 2024 | $3,633 | $118,200 | $22,150 | $96,050 |
| 2023 | $3,985 | $114,750 | $22,150 | $92,600 |
| 2022 | $2,821 | $105,600 | $22,150 | $83,450 |
| 2021 | $2,545 | $91,250 | $14,250 | $77,000 |
| 2020 | $2,443 | $89,550 | $14,250 | $75,300 |
| 2019 | $2,461 | $89,550 | $14,250 | $75,300 |
| 2018 | $2,487 | $89,550 | $14,250 | $75,300 |
| 2017 | $2,249 | $88,600 | $14,250 | $74,350 |
| 2016 | $1,473 | $76,600 | $21,400 | $55,200 |
| 2015 | $4,284 | $70,900 | $19,800 | $51,100 |
| 2014 | $4,223 | $64,450 | $18,000 | $46,450 |
| 2013 | $4,257 | $64,450 | $18,000 | $46,450 |
Source: Public Records
Map
Nearby Homes
- 351 Maple Point Blvd
- 355 Maple Point Blvd
- 347 Maple Point Blvd
- 345 Maple Point Blvd
- 349 Maple Point Blvd
- 357 Maple Point Blvd
- 343 Maple Point Blvd
- 365 Maple Point Blvd
- 348 Maple Point Blvd
- 350 Maple Point Blvd
- 346 Maple Point Blvd
- 359 Maple Point Blvd
- 352 Maple Point Blvd
- 344 Maple Point Blvd
- 363 Maple Point Blvd
- 354 Maple Point Blvd
- 342 Maple Point Blvd
- 356 Maple Point Blvd
- 465 Maple Pointe Blvd
- 356 Maple Point Blvd
Your Personal Tour Guide
Ask me questions while you tour the home.