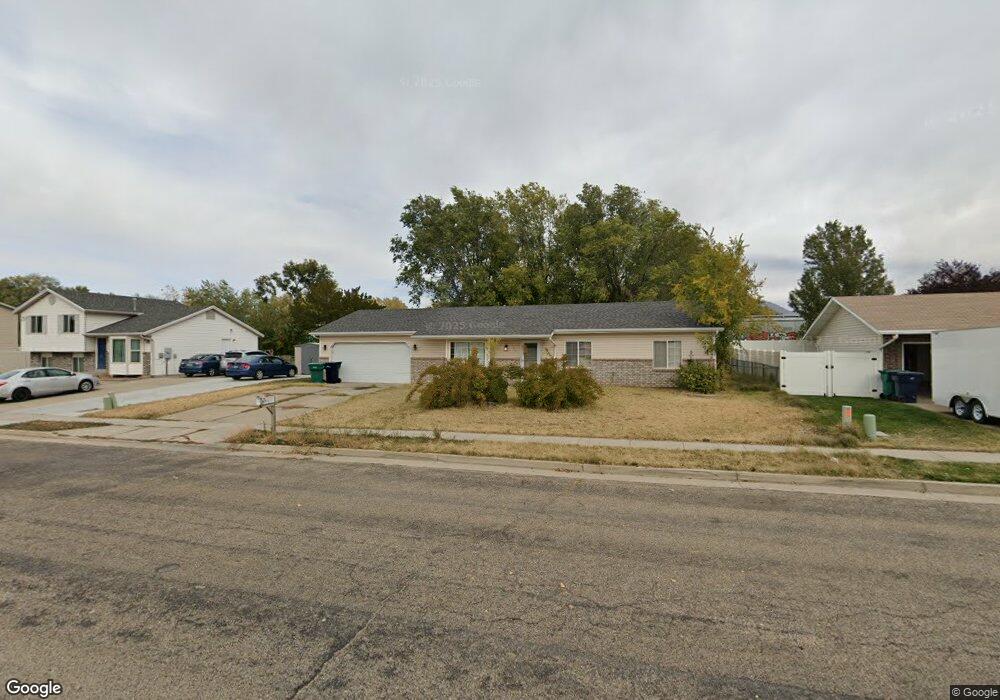
353 N 360 W Clearfield, UT 84015
Estimated Value: $404,000 - $430,000
3
Beds
2
Baths
1,176
Sq Ft
$353/Sq Ft
Est. Value
About This Home
This home is located at 353 N 360 W, Clearfield, UT 84015 and is currently estimated at $415,414, approximately $353 per square foot. 353 N 360 W is a home located in Davis County with nearby schools including Holt Elementary School, North Davis Junior High School, and Clearfield High School.
Ownership History
Date
Name
Owned For
Owner Type
Purchase Details
Closed on
Jan 22, 2010
Sold by
Rose Brent C and Rose Elizabeth D
Bought by
B&E Rose Properties Llc
Current Estimated Value
Purchase Details
Closed on
Apr 3, 2001
Sold by
Jackson Ron
Bought by
Rose Brent C and Rose Elizabeth D
Purchase Details
Closed on
Mar 4, 1999
Sold by
Matheson Dwayne A
Bought by
Jackson Ron
Home Financials for this Owner
Home Financials are based on the most recent Mortgage that was taken out on this home.
Original Mortgage
$89,600
Interest Rate
6.7%
Purchase Details
Closed on
Mar 20, 1997
Sold by
Wasatch West Lc
Bought by
Matheson Dwayne A
Create a Home Valuation Report for This Property
The Home Valuation Report is an in-depth analysis detailing your home's value as well as a comparison with similar homes in the area
Home Values in the Area
Average Home Value in this Area
Purchase History
| Date | Buyer | Sale Price | Title Company |
|---|---|---|---|
| B&E Rose Properties Llc | -- | Accommodation | |
| Rose Brent C | -- | Founders Title Co | |
| Jackson Ron | -- | Mountain View Title & Escrow | |
| Matheson Dwayne A | -- | Founders Title Company |
Source: Public Records
Mortgage History
| Date | Status | Borrower | Loan Amount |
|---|---|---|---|
| Previous Owner | Jackson Ron | $89,600 |
Source: Public Records
Tax History Compared to Growth
Tax History
| Year | Tax Paid | Tax Assessment Tax Assessment Total Assessment is a certain percentage of the fair market value that is determined by local assessors to be the total taxable value of land and additions on the property. | Land | Improvement |
|---|---|---|---|---|
| 2025 | $2,185 | $195,800 | $61,279 | $134,521 |
| 2024 | $2,108 | $190,299 | $58,586 | $131,713 |
| 2023 | $1,956 | $178,200 | $51,576 | $126,623 |
| 2022 | $2,087 | $340,000 | $97,686 | $242,314 |
| 2021 | $1,898 | $257,000 | $56,998 | $200,002 |
| 2020 | $1,636 | $220,000 | $47,912 | $172,088 |
| 2019 | $1,582 | $210,000 | $50,296 | $159,704 |
| 2018 | $1,431 | $185,000 | $44,643 | $140,357 |
| 2016 | $1,272 | $86,020 | $17,824 | $68,196 |
| 2015 | $1,297 | $83,600 | $17,824 | $65,776 |
| 2014 | $1,286 | $83,993 | $17,824 | $66,169 |
| 2013 | -- | $78,121 | $28,849 | $49,272 |
Source: Public Records
Map
Nearby Homes