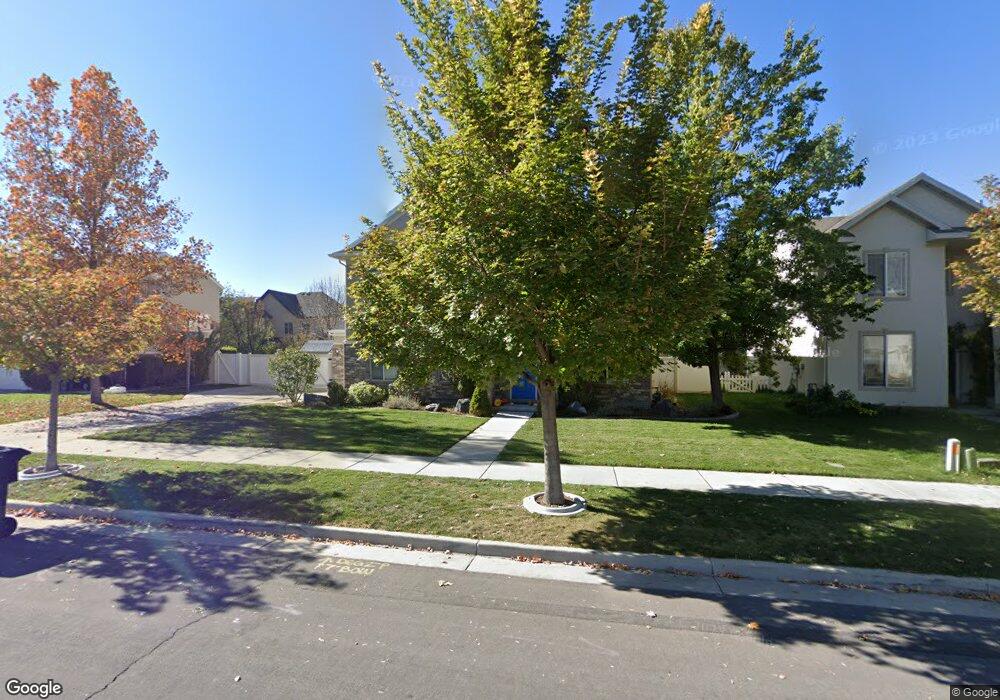
353 N 650 W Springville, UT 84663
Westfields North NeighborhoodEstimated Value: $582,000 - $630,000
4
Beds
3
Baths
2,636
Sq Ft
$231/Sq Ft
Est. Value
About This Home
This home is located at 353 N 650 W, Springville, UT 84663 and is currently estimated at $609,723, approximately $231 per square foot. 353 N 650 W is a home located in Utah County with nearby schools including Westside Elementary School, Springville Junior High School, and Springville High School.
Ownership History
Date
Name
Owned For
Owner Type
Purchase Details
Closed on
Jun 10, 2020
Sold by
David Eilars Joshua A and Ellars Rachel Nicole
Bought by
Allen Steven Paul and Allen Christie Anne
Current Estimated Value
Home Financials for this Owner
Home Financials are based on the most recent Mortgage that was taken out on this home.
Original Mortgage
$175,000
Outstanding Balance
$123,024
Interest Rate
3.2%
Mortgage Type
New Conventional
Estimated Equity
$486,699
Purchase Details
Closed on
Feb 18, 2016
Sold by
Rapier Blake D
Bought by
Ellars Joshua David and Ellars Rachel Nicole
Home Financials for this Owner
Home Financials are based on the most recent Mortgage that was taken out on this home.
Original Mortgage
$277,400
Interest Rate
3.97%
Mortgage Type
New Conventional
Create a Home Valuation Report for This Property
The Home Valuation Report is an in-depth analysis detailing your home's value as well as a comparison with similar homes in the area
Home Values in the Area
Average Home Value in this Area
Purchase History
| Date | Buyer | Sale Price | Title Company |
|---|---|---|---|
| Allen Steven Paul | -- | Capstone T&E Inc | |
| Ellars Joshua David | -- | Cottonwood Title |
Source: Public Records
Mortgage History
| Date | Status | Borrower | Loan Amount |
|---|---|---|---|
| Open | Allen Steven Paul | $175,000 | |
| Previous Owner | Ellars Joshua David | $277,400 |
Source: Public Records
Tax History Compared to Growth
Tax History
| Year | Tax Paid | Tax Assessment Tax Assessment Total Assessment is a certain percentage of the fair market value that is determined by local assessors to be the total taxable value of land and additions on the property. | Land | Improvement |
|---|---|---|---|---|
| 2025 | $2,912 | $573,900 | $191,000 | $382,900 |
| 2024 | $2,912 | $289,080 | $0 | $0 |
| 2023 | $2,841 | $284,625 | $0 | $0 |
| 2022 | $2,918 | $287,100 | $0 | $0 |
| 2021 | $2,501 | $382,500 | $123,700 | $258,800 |
| 2020 | $2,363 | $350,400 | $91,600 | $258,800 |
| 2019 | $2,148 | $323,900 | $88,200 | $235,700 |
| 2018 | $2,113 | $303,800 | $82,700 | $221,100 |
| 2017 | $2,007 | $153,065 | $0 | $0 |
| 2016 | $1,867 | $139,535 | $0 | $0 |
| 2015 | $1,740 | $132,605 | $0 | $0 |
| 2014 | $1,644 | $124,135 | $0 | $0 |
Source: Public Records
Map
Nearby Homes