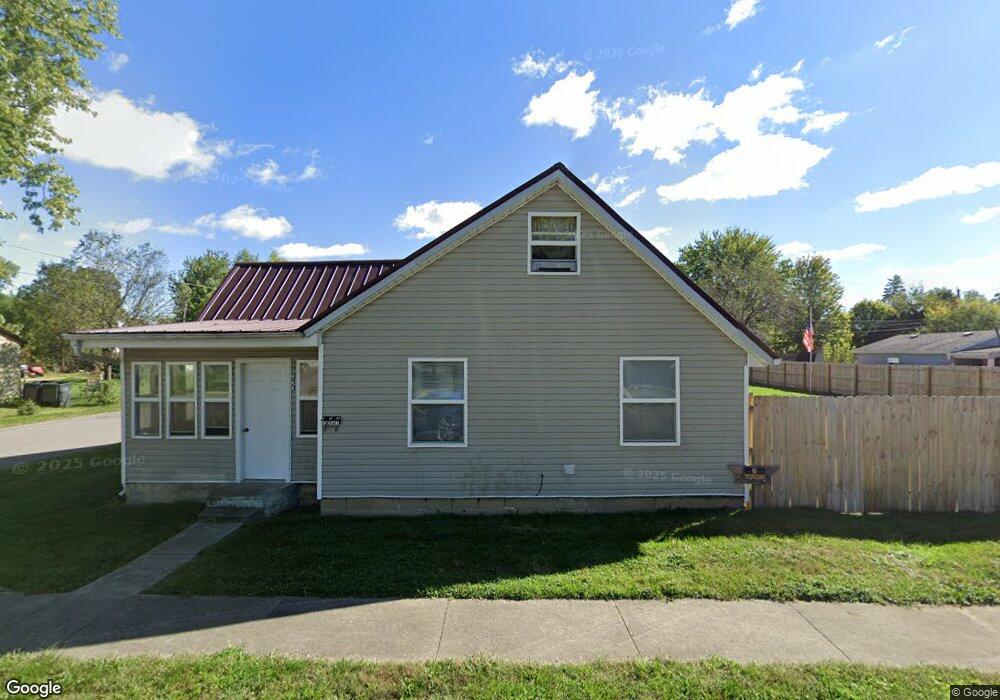
353 N Mound St Albany, IN 47320
Estimated Value: $113,000 - $138,000
3
Beds
2
Baths
2,396
Sq Ft
$52/Sq Ft
Est. Value
About This Home
This home is located at 353 N Mound St, Albany, IN 47320 and is currently estimated at $123,959, approximately $51 per square foot. 353 N Mound St is a home located in Delaware County with nearby schools including Albany Elementary School, Delta Middle School, and Delta High School.
Ownership History
Date
Name
Owned For
Owner Type
Purchase Details
Closed on
Sep 28, 2021
Sold by
Ashcraft Daniel A
Bought by
Ashcraft Daniel A and Ashcraft Jessica C
Current Estimated Value
Purchase Details
Closed on
Sep 25, 2007
Sold by
Hague Kenneth C and Hague Wanda C
Bought by
Ascraft Daniel A
Home Financials for this Owner
Home Financials are based on the most recent Mortgage that was taken out on this home.
Original Mortgage
$80,000
Outstanding Balance
$51,037
Interest Rate
6.63%
Mortgage Type
New Conventional
Estimated Equity
$72,922
Purchase Details
Closed on
Aug 12, 2005
Sold by
First National Bank Of Po9rtland Indiana
Bought by
Hague Kenneth C and Hague Wanda C
Home Financials for this Owner
Home Financials are based on the most recent Mortgage that was taken out on this home.
Original Mortgage
$12,080
Interest Rate
5.8%
Mortgage Type
Future Advance Clause Open End Mortgage
Purchase Details
Closed on
Jun 16, 2005
Sold by
Beal James M
Bought by
First National Bank
Home Financials for this Owner
Home Financials are based on the most recent Mortgage that was taken out on this home.
Original Mortgage
$12,080
Interest Rate
5.8%
Mortgage Type
Future Advance Clause Open End Mortgage
Create a Home Valuation Report for This Property
The Home Valuation Report is an in-depth analysis detailing your home's value as well as a comparison with similar homes in the area
Home Values in the Area
Average Home Value in this Area
Purchase History
| Date | Buyer | Sale Price | Title Company |
|---|---|---|---|
| Ashcraft Daniel A | -- | None Available | |
| Ascraft Daniel A | -- | None Available | |
| Hague Kenneth C | -- | None Available | |
| First National Bank | -- | None Available |
Source: Public Records
Mortgage History
| Date | Status | Borrower | Loan Amount |
|---|---|---|---|
| Open | Ascraft Daniel A | $80,000 | |
| Previous Owner | Hague Kenneth C | $12,080 |
Source: Public Records
Tax History Compared to Growth
Tax History
| Year | Tax Paid | Tax Assessment Tax Assessment Total Assessment is a certain percentage of the fair market value that is determined by local assessors to be the total taxable value of land and additions on the property. | Land | Improvement |
|---|---|---|---|---|
| 2024 | $379 | $60,900 | $7,000 | $53,900 |
| 2023 | $348 | $58,400 | $7,000 | $51,400 |
| 2022 | $294 | $59,000 | $7,000 | $52,000 |
| 2021 | $293 | $54,900 | $7,000 | $47,900 |
| 2020 | $298 | $54,900 | $7,000 | $47,900 |
| 2019 | $287 | $54,500 | $7,000 | $47,500 |
| 2018 | $262 | $54,500 | $7,000 | $47,500 |
| 2017 | $251 | $53,300 | $6,200 | $47,100 |
| 2016 | $248 | $53,700 | $6,200 | $47,500 |
| 2014 | $209 | $50,500 | $6,200 | $44,300 |
| 2013 | -- | $50,000 | $6,200 | $43,800 |
Source: Public Records
Map
Nearby Homes
- Maple Drive
- 621 W State St
- 649 W State St
- 927 W Walnut St
- 936 W Vine St
- N State Road 67
- 365 E Elm St
- 226 S Manor Ave
- 225 N Parker Ave
- 9661 E 700 Rd N
- 11817 E Edgewater Rd
- 1020 E State St
- 475 Gillcrest Dr
- Lot 19 E Case Blvd
- 14145 E County Road 1100 N
- 10700 N State Rd 67 28
- 6300 850 E
- 12880 N Old Granville Rd
- 14820 N Co Road 400 E
- 18611 Indiana 167
- 329 N Mound St
- 401 N Mound St
- 321 N Mound St
- 507 W High St
- 348 N Mound St
- 309 N Mound St
- 508 W High St
- 308 N Delaware St
- 492 N Delaware St
- 301 N Mound St
- 600 Green St
- 608 W High St
- 617 W High St
- 496 N Delaware St
- 612 Green St
- 345 N Delaware St
- 297 N Mound St
- 628 Green St
- 401 N Delaware St
- 500 N Delaware St