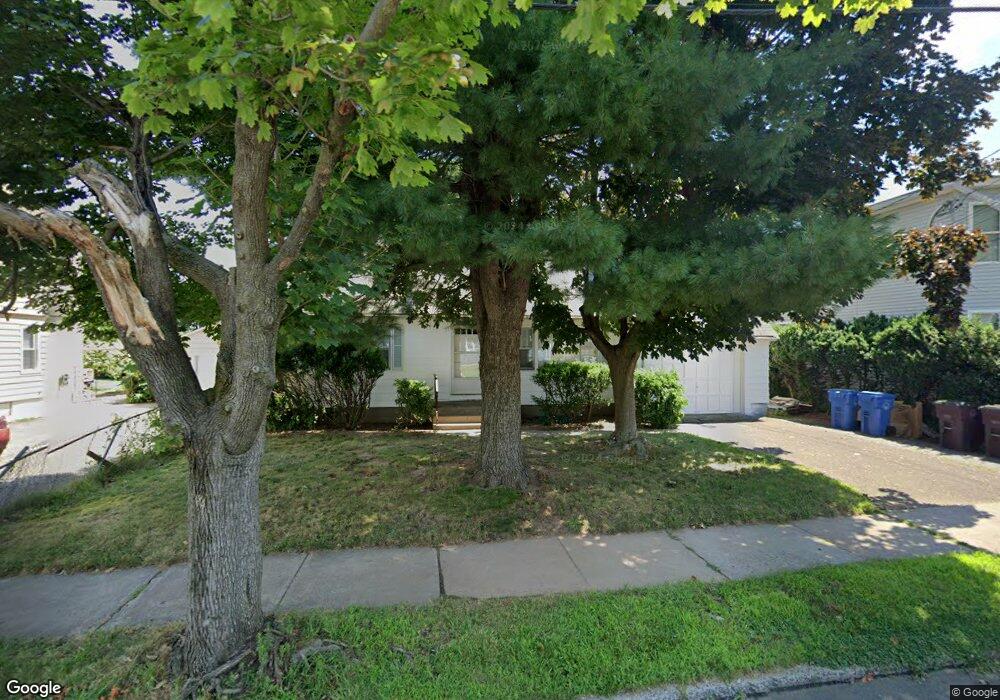
353 Oak St New Britain, CT 06051
Estimated Value: $216,000 - $318,000
3
Beds
2
Baths
1,475
Sq Ft
$183/Sq Ft
Est. Value
About This Home
This home is located at 353 Oak St, New Britain, CT 06051 and is currently estimated at $270,172, approximately $183 per square foot. 353 Oak St is a home located in Hartford County with nearby schools including Holmes School, Pulaski Middle School, and Mountain Laurel Sudbury School.
Ownership History
Date
Name
Owned For
Owner Type
Purchase Details
Closed on
Aug 5, 2021
Sold by
Nicholas Cozzolongo Jr T
Bought by
Bykowski Kevin
Current Estimated Value
Home Financials for this Owner
Home Financials are based on the most recent Mortgage that was taken out on this home.
Original Mortgage
$65,661
Outstanding Balance
$59,795
Interest Rate
3%
Mortgage Type
Purchase Money Mortgage
Estimated Equity
$210,377
Purchase Details
Closed on
Apr 4, 2012
Sold by
Cozzolongo Christine
Bought by
Cozzolongo Nicholas and Reinwald Laura A
Purchase Details
Closed on
Jan 10, 2012
Sold by
Cozzolongo Christine
Bought by
Nd N Cozzolongo Jr Spe and Reinwald Laura A
Purchase Details
Closed on
Jul 7, 2010
Sold by
Cozzolongo Christine M
Bought by
Cozzolongo Christine
Purchase Details
Closed on
Mar 14, 1988
Sold by
Kirschenbaum David
Bought by
Rulnick Sara A
Purchase Details
Closed on
Apr 13, 1987
Sold by
Seleg William
Bought by
Carmon & Co
Create a Home Valuation Report for This Property
The Home Valuation Report is an in-depth analysis detailing your home's value as well as a comparison with similar homes in the area
Home Values in the Area
Average Home Value in this Area
Purchase History
| Date | Buyer | Sale Price | Title Company |
|---|---|---|---|
| Bykowski Kevin | $65,000 | None Available | |
| Cozzolongo Nicholas | -- | -- | |
| Nd N Cozzolongo Jr Spe | -- | -- | |
| Cozzolongo Christine | -- | -- | |
| Cozzolongo Christine | -- | -- | |
| Rulnick Sara A | $330,000 | -- | |
| Carmon & Co | $16,000 | -- |
Source: Public Records
Mortgage History
| Date | Status | Borrower | Loan Amount |
|---|---|---|---|
| Open | Bykowski Kevin | $65,661 |
Source: Public Records
Tax History Compared to Growth
Tax History
| Year | Tax Paid | Tax Assessment Tax Assessment Total Assessment is a certain percentage of the fair market value that is determined by local assessors to be the total taxable value of land and additions on the property. | Land | Improvement |
|---|---|---|---|---|
| 2025 | $5,578 | $142,380 | $50,400 | $91,980 |
| 2024 | $5,637 | $142,380 | $50,400 | $91,980 |
| 2023 | $5,450 | $142,380 | $50,400 | $91,980 |
| 2022 | $4,678 | $94,500 | $23,240 | $71,260 |
| 2021 | $4,678 | $94,500 | $23,240 | $71,260 |
| 2020 | $4,772 | $94,500 | $23,240 | $71,260 |
| 2019 | $4,772 | $94,500 | $23,240 | $71,260 |
| 2018 | $5,935 | $117,530 | $23,240 | $94,290 |
| 2017 | $4,596 | $91,000 | $21,140 | $69,860 |
| 2016 | $5,599 | $110,880 | $21,140 | $89,740 |
| 2015 | $5,433 | $110,880 | $21,140 | $89,740 |
| 2014 | $5,433 | $110,880 | $21,140 | $89,740 |
Source: Public Records
Map
Nearby Homes